Confirming payment details

Payment processing
Login or Sign up
Forgot password
Enter your email address and we will send you a password reset link or need more help?
City level house prices up 10.2% over year but sales down 2% as market braces for impact of Brexit and stamp duty changes
On 26 February, 2016- Transactions down by as much as 20% in Cambridge and 7% in London
- Brexit uncertainty likely to impact volumes further along with stamp duty changes
- Report questions the sustainability of house price growth as volumes slow
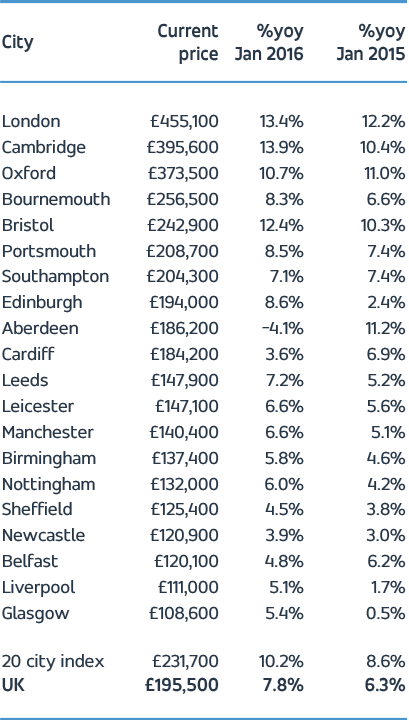
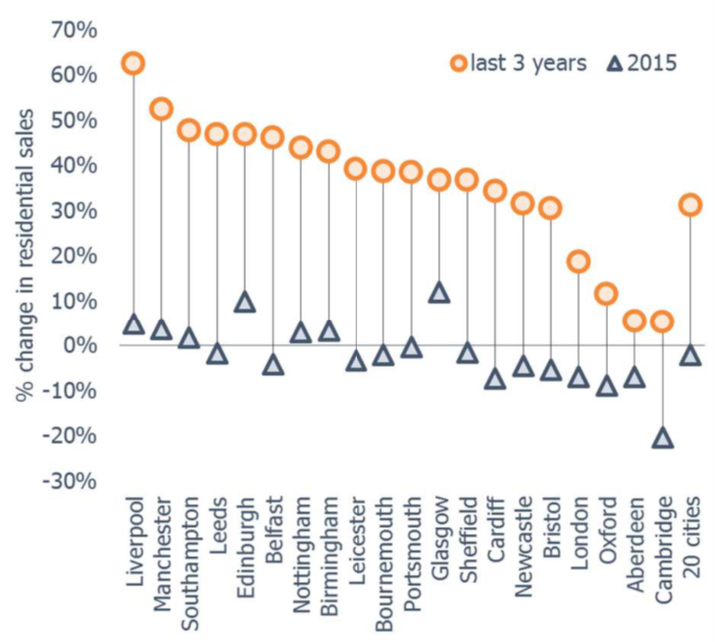
Hometrack’s UK Cities House Price Index today reveals that the number of housing sales over the past 12 months has fallen by 2% across the UK’s top 20 cities.
London has seen a 7% dip in transactions and Cambridge has seen sales fall by a fifth (20%) over the same period. Meanwhile city level house price inflation has increased to 10.2%, up from 8.6% a year ago largely due to constricted supply. The average UK city house price currently stands at £231,700 ranging from £109,000 in Glasgow to £455,000 across London.
However, there are signs that the annual rate of growth in high growth cities in southern England is starting to plateau as the level of housing sales slows and affordability pressures on would-be buyers increase. Uncertainty around the so-called ‘Brexit referendum’ is also likely to slow activity further. Questions remain as to the level to which the campaign will influence households’ decision making and overall levels of housing market activity. The Brexit referendum comes at a time when other policy measures such as higher stamp duty for investors and second home owners are expected to impact market activity from investors who accounted for 1 in 5 sales in 2015
Richard Donnell, Insight Director at Hometrack says:
"Slower growth in sales volumes has been a trend seen over the last 3 years across the high value, high growth cities such as Cambridge, Oxford, Aberdeen and London where house prices have been rising for six consecutive years. High housing and moving costs are limiting access to the market for a growing number of households which, in our view, will result in lower turnover and slower house price growth."
"The EU referendum adds further complexity to an already complex outlook. Our analysis shows that the Scottish referendum, and the 18 month campaign that preceded it, resulted in 10% fewer transactions and slower house price growth over the period relative to England. The shorter run up to the EU vote will help but the true impact will depend on how quickly the campaigning focuses on the economic ramifications for UK households and the knock on effect for housing related decisions as Scotland proved. A vote to remain in the EU should see a return to business as usual whereas a vote to leave will create additional uncertainty."
“After a 3 year upturn in housing market activity and house prices the outlook for the market appears increasingly tied up with policy impacts and the potential outcome of the referendum rather than the operation of market forces. Businesses operating in housing face risk and uncertainty which will have to be managed and monitored carefully.”
The Hometrack UK Cities House Price Index is Not Seasonally Adjusted
NOTE – The definition of London ‘City’ is larger than the London Government Region. The ‘City definition extends further out into London’s travel to work area capturing the commuter areas outside the 33 London Boroughs. The London ‘City’ area covers 44 local authorities and better represents the housing markets that are influenced by the London economy.
-ENDS-
About the Hometrack UK Cities House Price Index
The new Hometrack UK Cities House Price index has been designed to provide a granular analysis of housing market trends at a city level – cities are the focus for economic and demographic change as well as a focus for greater cross-area collaboration. The 20 cities in this new house price index cover a land area that is less than 5% of the UK but the cities contain over 40% of the value of UK housing and a similar proportion of all UK jobs. (See notes for more information on the index series.)
NOTES FOR EDITORS
1. Hometrack’s house price indices (HPI) are designed to track, as closely as possible, the performance of UK residential capital values over time. We have a track record of developing and running proprietary, localised, sub-regional house price indices for over a decade. Localised house price indices form a key part of the Hometrack automated valuation model where indexation is a key element of the valuation system. This valuation system is trusted by 4 of the top 5 lenders in the UK.
2. From October 2014, we are publishing a unique index based on 20 UK cities. We will also be producing indexes for the UK, Government Regions and the countries of Scotland, Wales and Northern Ireland. Interactive analysis, further information and FAQs on the index can be found at www.hometrack.com.
3. This new Hometrack UK Cities House Price Index is very different to our historic monthly housing survey which was an aggregation of the views of a large sample of agents and surveyors on key market trends in their local area. The survey has been dis-continued. Selected market metrics from the survey are being calculated from listings data and are available in Hometrack products and services.
4. The geographic definition of a city is based upon Primary Urban Areas – these cover the built up area of a city or a city region. Primary Urban Areas for English cities were defined in a report published by Government entitled The State of the English Cities Volume 1, ODPM, 2006. All cities are based upon amalgamations of single or multiple local authorities. The Primary Urban Area methodology has been applied to major cities across the rest of the UK covering Scotland, Wales and Northern Ireland.
5. Hometrack’s UK Cities House Price Index is created using a repeat sales based methodology drawing upon a large database comprising 100% of recorded sales prices from the Land Registry ‘Price Paid’ dataset and equivalent data from the Registers of Scotland. This price paid data is supplemented by mortgage valuation data.
6. The Hometrack UK Cities House Price Index is weighted according to the volume of private housing stock in each geographic area. The property type weightings are adjusted dynamically over time each quarter as the stock of housing grows, but the absolute changes are small.
7. The primary output of the UK Cities House Price Index build process is a monthly ‘multiplier’, the amount by which house prices have changed over the period based on the available evidence for the relevant geography. This monthly multiplier is used to create an index of house prices.
8. The Hometrack UK Cities House Price Index is revisionary i.e. there are revisions each month as more data comes available as sales are registered and further information becomes available. All UK house price indices are published on a revisionary basis. The scale of monthly revisions tends to be larger for smaller geographies where sales volumes are lower and indices can be more volatile at the leading edge. The historic revisions are minimal for the largest geographies.
9. The series are supplied on a non-seasonally adjusted basis.
10. In order to calculate the average price, the monthly price changes are applied to an average price to create a time series for average house prices from a base date which was in December 2013.
11. All average prices and percentage changes are expressed in nominal terms i.e. not adjusted for inflation.
12. Further information can be found at ww.hometrack.com
The latest Hometrack UK Cities Index reveals that in the three months to September house price inflation in London recorded the lowest quarterly growth for 20 months.
The latest Hometrack UK Cities Index reveals house price growth has fallen to 8.2% as the slowdown seen in cities across the south of England in recent months intensified in August.
London, Tuesday 13th September: Hometrack has been appointed by digital challenger bank, Atom, to provide a range of Automated Valuation Model (AVM) services.
The latest Hometrack UK Cities House Price Index reveals a marked slowdown in house price growth over the last three months, led by a deceleration in London and other high value cities across the south of England.

Subscribe to receive email updates.
HometrackGlobal:
Linked In: