Confirming payment details

Payment processing
Login or Sign up
Forgot password
Enter your email address and we will send you a password reset link or need more help?
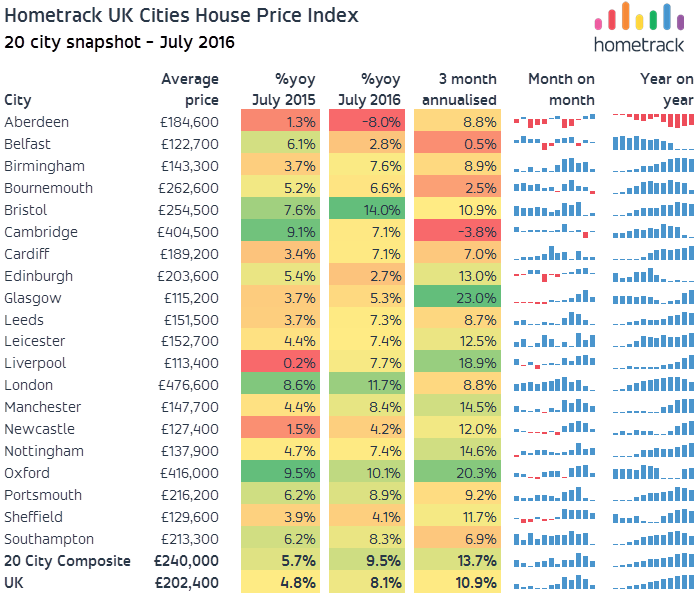
July 2016 Hometrack UK Cities: UK city house price inflation running at 9.5% but starting to slow as rate of growth in North and Scotland set to outpace London and the South
On 26 August, 2016- London house price growth in three months to July is the lowest quarterly change for 17 months (since Feb 2015)
- Meanwhile, large regional cities outside southern England continue to hold steady with growth at 7-8% per annum and with no sign of an imminent slowdown
The latest Hometrack UK Cities House Price Index reveals a marked slowdown in house price growth over the last three months, led by a deceleration in London and other high value cities across the south of England.
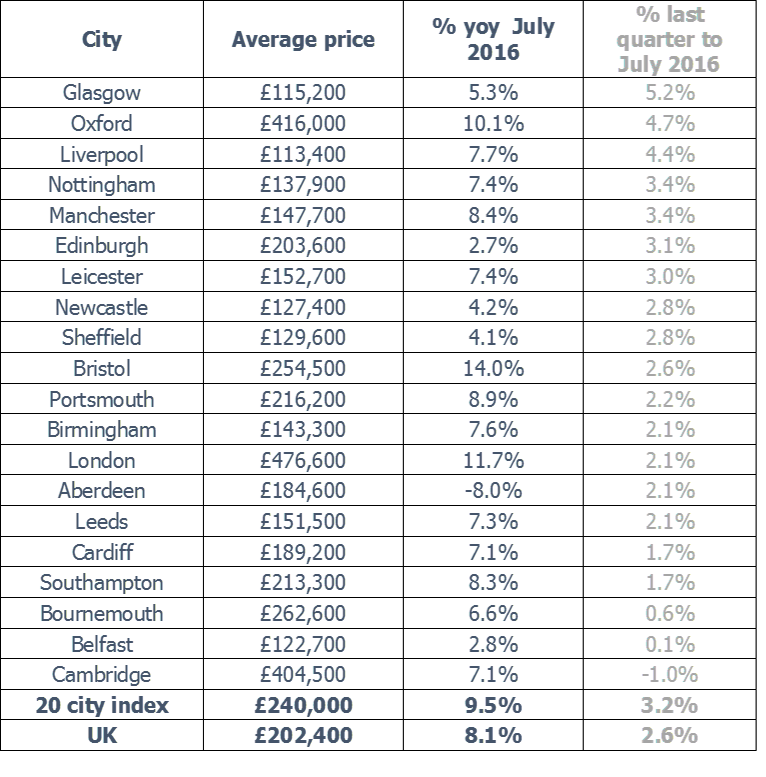
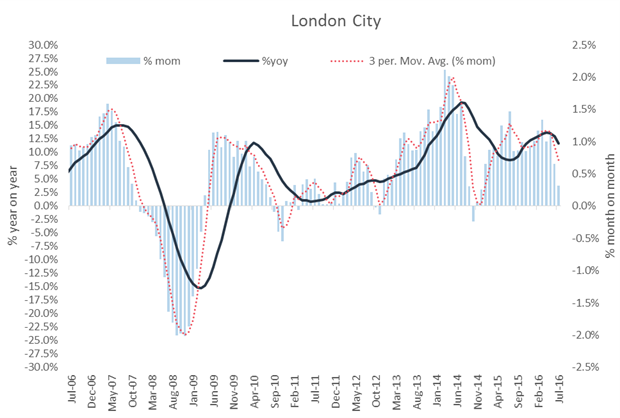
The annual rate of house price inflation across the 20 cities slowed to 9.5% in July after 12 months of higher growth (See Figure 1). The shift in momentum was due to growth stalling across a number of cities in southern England over the last quarter. In the three months to July house prices in London rose by just 2.1%, the lowest quarterly rate since February 2015. Furthermore, Bristol, which is the fastest growing city over the last 12 months, saw growth over the last 3 months slow to 2.6% from a recent high of 5.0% in May 2016. Prices in Cambridge fell by 1% in the last quarter although over the lst 12 months prices are 7.1% higher. (See Figure 2).
However, Hometrack can also reveal that house price inflation in many large regional cities in the north of England and Scotland shows no signs of slowing. The rate of annual house price growth in Leeds, Manchester, Birmingham, Liverpool and Nottingham continues to rise by between 7% and 8%. Focusing on activity in the last quarter, the highest rates of growth have been registered in lower value, high yielding cities where prices are rising of a lower base – Glasgow (5.2%), Liverpool (4.4%), Manchester and Nottingham (3.4%).
In Aberdeen the year-on-year rate of growth fell at a slower rate of -8.0% in July with prices up 2% in the last quarter, a sign that the housing market may have adjusted to the impact of falling oil prices on demand over the last 12 months.
Richard Donnell, Insight Director at Hometrack says: “In the absence of adverse economic trends impacting employment and mortgage rates, the near term outlook is for a continued slowdown in London towards mid-single digit growth. The slowdown in London is being seen across the market is not accounted for by seasonal factors with weaker demand from home owners and investors as supply grows. This analysis suggests London house price growth will continue to slow over the rest of the year. In contrast, northern regional cities will continue to register stable growth rates as households’ benefit from record low mortgages rates and affordability remains attractive.”
“We continue to believe that turnover will register the brunt of the slowdown in London. In the face of lower sales volumes agents will look to re-price stock in line with what buyers are prepared, and can afford to pay. Past experience shows that this process can run for as long as 6 months and relies, in part, in how quickly sellers are willing to adjust to what buyers are prepared to pay.”
The Hometrack UK Cities House Price Index is Not Seasonally Adjusted
NOTE – The definition of London ‘City’ is larger than the London Government Region. The ‘City definition extends further out into London’s travel to work area capturing the commuter areas outside the 33 London Boroughs. The London ‘City’ area covers 44 local authorities and better represents the housing markets that are influenced by the London economy.
-ENDS-
About the Hometrack UK Cities House Price Index
The new Hometrack UK Cities House Price index has been designed to provide a granular analysis of housing market trends at a city level – cities are the focus for economic and demographic change as well as a focus for greater cross-area collaboration. The 20 cities in this new house price index cover a land area that is less than 5% of the UK but the cities contain over 40% of the value of UK housing and a similar proportion of all UK jobs. (See notes for more information on the index series.)
NOTES FOR EDITORS
1. Hometrack’s house price indices (HPI) are designed to track, as closely as possible, the performance of UK residential capital values over time. We have a track record of developing and running proprietary, localised, sub-regional house price indices for over a decade. Localised house price indices form a key part of the Hometrack automated valuation model where indexation is a key element of the valuation system. This valuation system is trusted by 4 of the top 5 lenders in the UK.
2. From October 2014, we are publishing a unique index based on 20 UK cities. We will also be producing indexes for the UK, Government Regions and the countries of Scotland, Wales and Northern Ireland. Interactive analysis, further information and FAQs on the index can be found at www.hometrack.com.
3. This new Hometrack UK Cities House Price Index is very different to our historic monthly housing survey which was an aggregation of the views of a large sample of agents and surveyors on key market trends in their local area. The survey has been dis-continued. Selected market metrics from the survey are being calculated from listings data and are available in Hometrack products and services.
4. The geographic definition of a city is based upon Primary Urban Areas – these cover the built up area of a city or a city region. Primary Urban Areas for English cities were defined in a report published by Government entitled The State of the English Cities Volume 1, ODPM, 2006. All cities are based upon amalgamations of single or multiple local authorities. The Primary Urban Area methodology has been applied to major cities across the rest of the UK covering Scotland, Wales and Northern Ireland.
5. Hometrack’s UK Cities House Price Index is created using a repeat sales based methodology drawing upon a large database comprising 100% of recorded sales prices from the Land Registry ‘Price Paid’ dataset and equivalent data from the Registers of Scotland. This price paid data is supplemented by mortgage valuation data.
6. The Hometrack UK Cities House Price Index is weighted according to the volume of private housing stock in each geographic area. The property type weightings are adjusted dynamically over time each quarter as the stock of housing grows, but the absolute changes are small.
7. The primary output of the UK Cities House Price Index build process is a monthly ‘multiplier’, the amount by which house prices have changed over the period based on the available evidence for the relevant geography. This monthly multiplier is used to create an index of house prices.
8. The Hometrack UK Cities House Price Index is revisionary i.e. there are revisions each month as more data comes available as sales are registered and further information becomes available. All UK house price indices are published on a revisionary basis. The scale of monthly revisions tends to be larger for smaller geographies where sales volumes are lower and indices can be more volatile at the leading edge. The historic revisions are minimal for the largest geographies.
9. The series are supplied on a non-seasonally adjusted basis.
10. In order to calculate the average price, the monthly price changes are applied to an average price to create a time series for average house prices from a base date which was in December 2013.
11. All average prices and percentage changes are expressed in nominal terms i.e. not adjusted for inflation.
12. Further information can be found at ww.hometrack.com
The latest Hometrack UK Cities Index reveals that in the three months to September house price inflation in London recorded the lowest quarterly growth for 20 months.
The latest Hometrack UK Cities Index reveals house price growth has fallen to 8.2% as the slowdown seen in cities across the south of England in recent months intensified in August.
London, Tuesday 13th September: Hometrack has been appointed by digital challenger bank, Atom, to provide a range of Automated Valuation Model (AVM) services.
The latest Hometrack UK Cities House Price Index reveals that annual house price inflation plateaued at 10.2% in June, the same level as May 2016, but still ahead of 6.9% growth seen in June 2015.

Subscribe to receive email updates.
HometrackGlobal:
Linked In: