Confirming payment details

Payment processing
Login or Sign up
Forgot password
Enter your email address and we will send you a password reset link or need more help?
June 2015 Hometrack UK Cities House Price Index: City level house prices up by 6.4% in first half of the year and on track to break 10% by year end
On 24 July, 2015- Hometrack UK Cities Index running at 8.4% year on year; prices up 4.3% in last quarter.
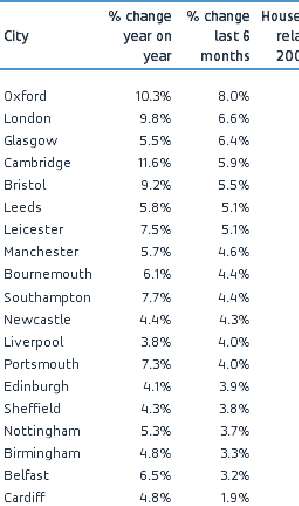
- Fastest growing cities in 2015 H1 are Oxford (8%), London (6.6%) and Glasgow (6.4%)
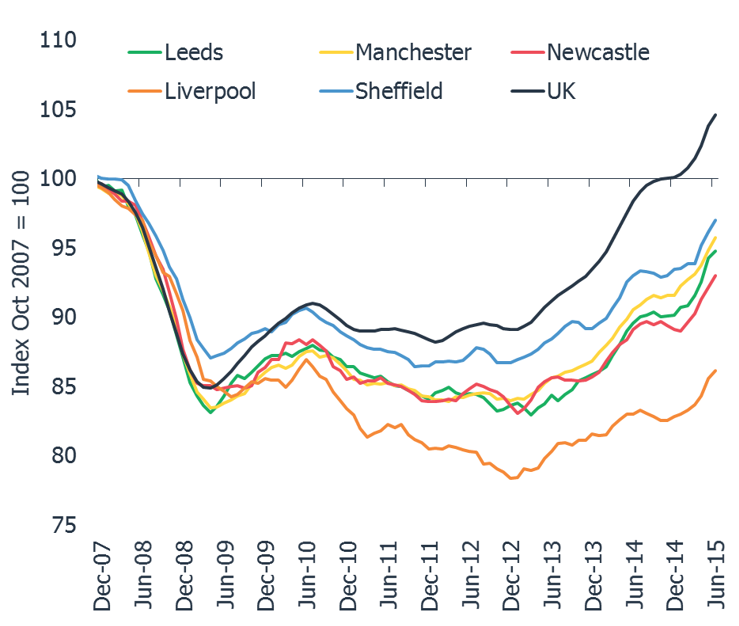
- Northern powerhouse cities like Leeds, Manchester, Liverpool and Sheffield have all registered a pick-up in growth since 2013 but average prices are still below 2007 level
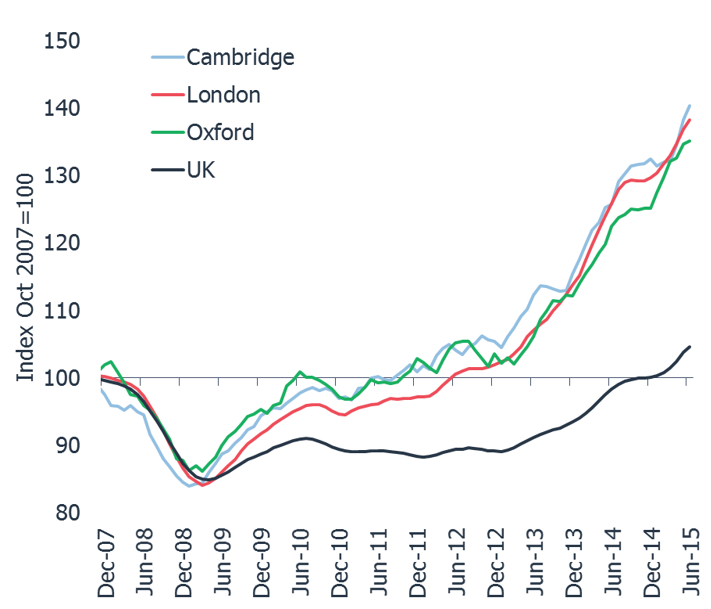
- Oxford and Cambridge continue to perform like direct extensions of the London market
- The timing of a rate rise in uncertain but any upward shift in interest rates would impact market sentiment and reduce the rate of house price growth
City level house price inflation is running at 8.4% per annum. Growth in the first half of 2015 was 6.3% and looks set to exceed 10% over 2015 as the recovery in house price spreads. Rising interest rates pose the greatest risk to the market with small increases likely to cool demand and reduce the rate of growth.
London, 24 July 2015 – House price inflation across the UKs 20 largest cities was 6.4% in the first half of 2015 according to the Hometrack UK Cities House Price Index. Glasgow recorded the third fastest growth in 2015 H1 after Oxford and London as the housing recovery spreads. Aberdeen was the weakest performer with house prices flat in the first half of the year.
The year on year rate of growth across all 20 cities covered by the index is 8.4% with an average price of £226,200. At a city level this ranges from 11.6% in Cambridge to 2.9% in Liverpool. Oxford and Cambridge continue to perform like extensions of the London market with all cities having a very similar profile of house price growth over the last 8 years.

Looking to the second half of the year the headline rate of growth across the 20 cities index looks set to move higher as continued growth in house prices pushes the year on rate towards 10% as the recovery spreads and households continue to price low mortgage rates into house prices.
The greatest risk on the horizon, is an increase in interest rates, recently highlighted by the Bank of England Governor. 57% of outstanding mortgage debt is on variables rates which is lower than the 73% high registered in mid-2012. While a year’s worth of new buyers have been subject to tougher affordability tests the majority of mortgagees have not. While many homeowners have continued to pay off debt while rates have been low any increase in mortgage rates is likely to impact market sentiment which given the shortage of supply would result in a marked slowdown in the rate of house price growth.
Richard Donnell, Director of Research at residential analysts Hometrack, said:
“Rising demand for house against a backdrop of low supply continues push city level house prices higher. At 8.4%, city level house price inflation is running higher than the overall UK rate. While house price growth might moderate slightly in H2 it looks increasingly likely that city level house price growth will return to double digits by the year end.
The greatest risk facing the housing market is an upward movement in interest rates which would check market sentiment, cool demand and result in a marked slowdown in house price growth.
The Hometrack UK Cities House Price Index is Not Seasonally Adjusted
NOTE – The definition of London ‘City’ is larger than the London Government Region. The ‘City definition extends further out into London’s travel to work area capturing the commuter areas outside the 33 London Boroughs. The London ‘City’ area covers 44 local authorities and better represents the housing markets that are influenced by the London economy.
-ENDS-
About the Hometrack UK Cities House Price Index
The new Hometrack UK Cities House Price index has been designed to provide a granular analysis of housing market trends at a city level – cities are the focus for economic and demographic change as well as a focus for greater cross-area collaboration. The 20 cities in this new house price index cover a land area that is less than 5% of the UK but the cities contain over 40% of the value of UK housing and a similar proportion of all UK jobs. (See notes for more information on the index series.)
NOTES FOR EDITORS
1. Hometrack’s house price indices (HPI) are designed to track, as closely as possible, the performance of UK residential capital values over time. We have a track record of developing and running proprietary, localised, sub-regional house price indices for over a decade. Localised house price indices form a key part of the Hometrack automated valuation model where indexation is a key element of the valuation system. This valuation system is trusted by 4 of the top 5 lenders in the UK.
2. From October 2014, we are publishing a unique index based on 20 UK cities. We will also be producing indexes for the UK, Government Regions and the countries of Scotland, Wales and Northern Ireland. Interactive analysis, further information and FAQs on the index can be found at www.hometrack.com.
3. This new Hometrack UK Cities House Price Index is very different to our historic monthly housing survey which was an aggregation of the views of a large sample of agents and surveyors on key market trends in their local area. The survey has been dis-continued. Selected market metrics from the survey are being calculated from listings data and are available in Hometrack products and services.
4. The geographic definition of a city is based upon Primary Urban Areas – these cover the built up area of a city or a city region. Primary Urban Areas for English cities were defined in a report published by Government entitled The State of the English Cities Volume 1, ODPM, 2006. All cities are based upon amalgamations of single or multiple local authorities. The Primary Urban Area methodology has been applied to major cities across the rest of the UK covering Scotland, Wales and Northern Ireland.
5. Hometrack’s UK Cities House Price Index is created using a repeat sales based methodology drawing upon a large database comprising 100% of recorded sales prices from the Land Registry ‘Price Paid’ dataset and equivalent data from the Registers of Scotland. This price paid data is supplemented by mortgage valuation data.
6. The Hometrack UK Cities House Price Index is weighted according to the volume of private housing stock in each geographic area. The property type weightings are adjusted dynamically over time each quarter as the stock of housing grows, but the absolute changes are small.
7. The primary output of the UK Cities House Price Index build process is a monthly ‘multiplier’, the amount by which house prices have changed over the period based on the available evidence for the relevant geography. This monthly multiplier is used to create an index of house prices.
8. The Hometrack UK Cities House Price Index is revisionary i.e. there are revisions each month as more data comes available as sales are registered and further information becomes available. All UK house price indices are published on a revisionary basis. The scale of monthly revisions tends to be larger for smaller geographies where sales volumes are lower and indices can be more volatile at the leading edge. The historic revisions are minimal for the largest geographies.
9. The series are supplied on a non-seasonally adjusted basis.
10. In order to calculate the average price, the monthly price changes are applied to an average price to create a time series for average house prices from a base date which was in December 2013.
11. All average prices and percentage changes are expressed in nominal terms i.e. not adjusted for inflation.
12. Further information can be found at ww.hometrack.com
The latest Hometrack UK Cities Index reveals that in the three months to September house price inflation in London recorded the lowest quarterly growth for 20 months.
The latest Hometrack UK Cities Index reveals house price growth has fallen to 8.2% as the slowdown seen in cities across the south of England in recent months intensified in August.
London, Tuesday 13th September: Hometrack has been appointed by digital challenger bank, Atom, to provide a range of Automated Valuation Model (AVM) services.
The latest Hometrack UK Cities House Price Index reveals a marked slowdown in house price growth over the last three months, led by a deceleration in London and other high value cities across the south of England.

Subscribe to receive email updates.
HometrackGlobal:
Linked In: