Confirming payment details

Payment processing
Login or Sign up
Forgot password
Enter your email address and we will send you a password reset link or need more help?
June 2016 Cities Index: City house price growth plateaus in June as sales and new supply dynamics start to shift post Brexit
On 22 July, 2016- Latest Hometrack UK Cities House Price Index saw annual growth stall at 10.2%, with large regional cities registering stronger price appreciation in the last quarter
- Unique analysis of property listings data at city level to mid-July shows sales momentum in regional cities appears to have held up over the EU referendum period over the last quarter.
- In contrast, the London market has seen a widening gap between growing new supply and lower sales pointing to slower house price growth in the months ahead.
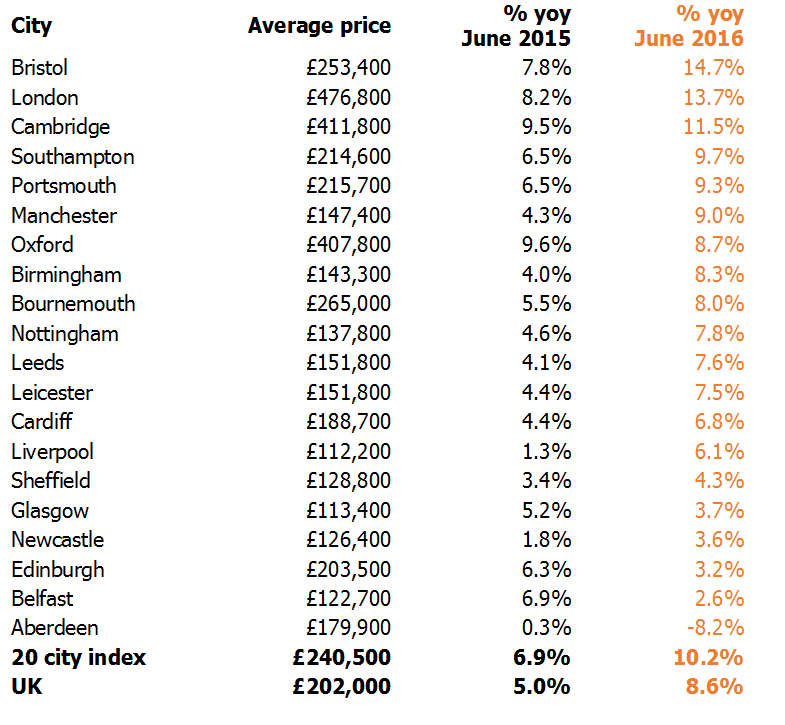
The latest Hometrack UK Cities House Price Index reveals that annual house price inflation plateaued at 10.2% in June, the same level as May 2016, but still ahead of 6.9% growth seen in June 2015.
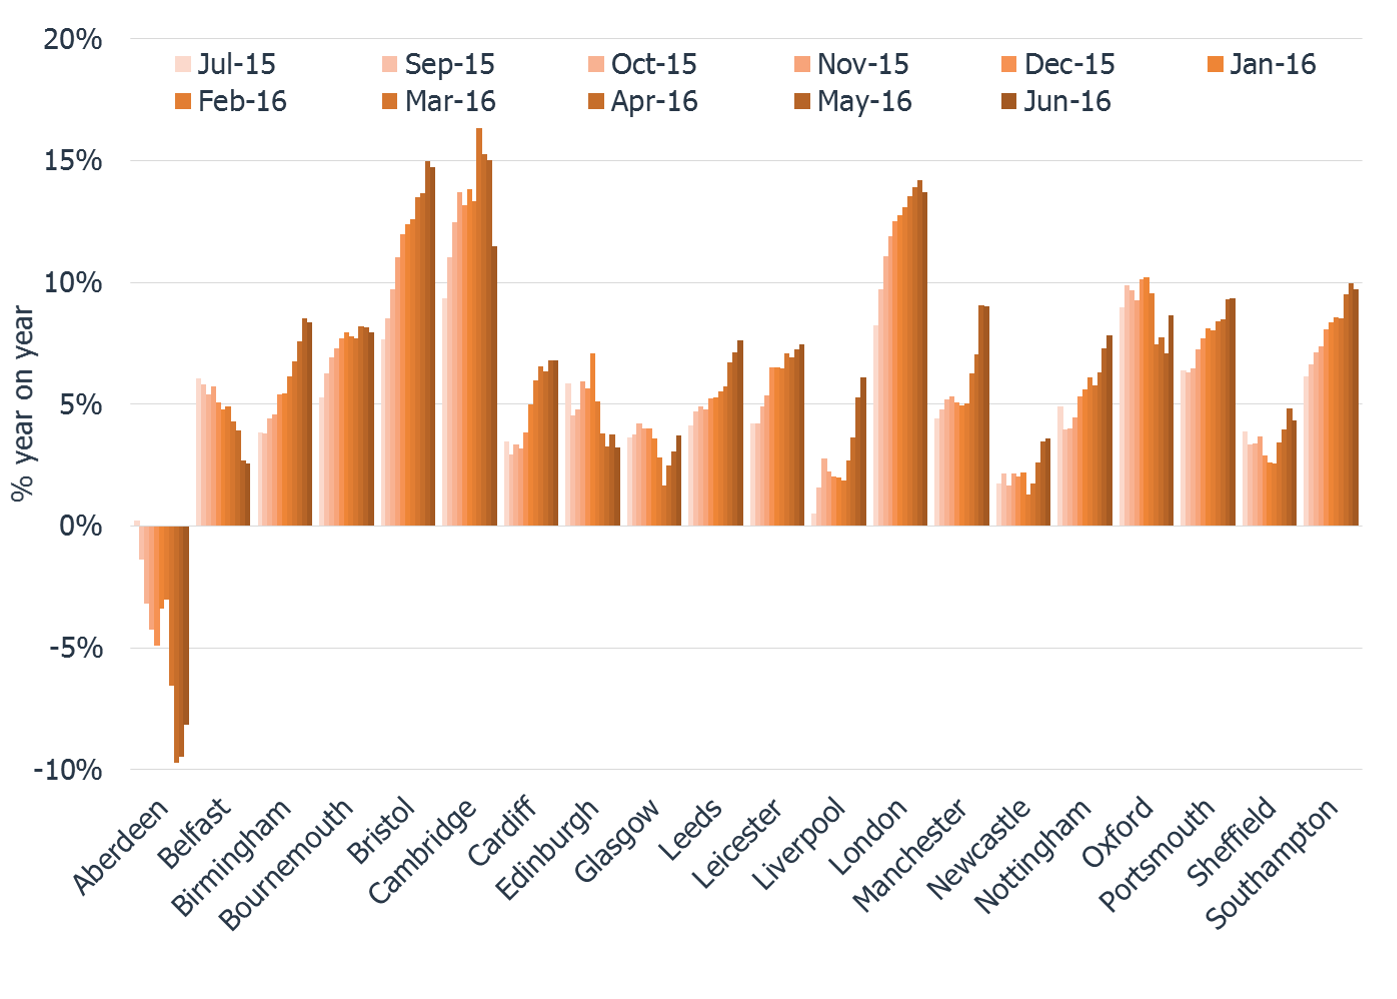
Bristol remains the fastest growing city in the UK with a year on year growth rate of 14.7%, but year-on-year house price inflation in London and in other cities in the south of England, such as Cambridge, Southampton and Bournemouth started to slow between May and June 2016 (see figure 1). Conversely, large cities in northern parts of the UK such as Glasgow, Manchester, Liverpool and Leeds have registered strong growth in the last quarter on the back of more affordable prices, lower interest rates, improving local economies and higher yields making purchases attractive to investors.
In the wake of the vote to leave the EU attention has turned to the impact on the economy and housing market. Time lags means official data is slow to pick up changes and housing is notoriously slow for changes of direction to emerge.
Hometrack have carried out unique analysis of recent market activity up the middle of July analysing trends in new property listings and sales at a city level. Changes in the balance of supply and sales provide an early insight into trends in turnover and whether supply is starting to expand which could reduce price growth.
Looking at the three months to mid-July the analysis shows that recent sales momentum in regional cities, and higher house price growth, appears to have held up over the referendum period. In contrast, the headwinds facing the London market ahead of the vote have resulted in rising supply and relatively fewer sales pointing to slower house price growth in the months ahead.
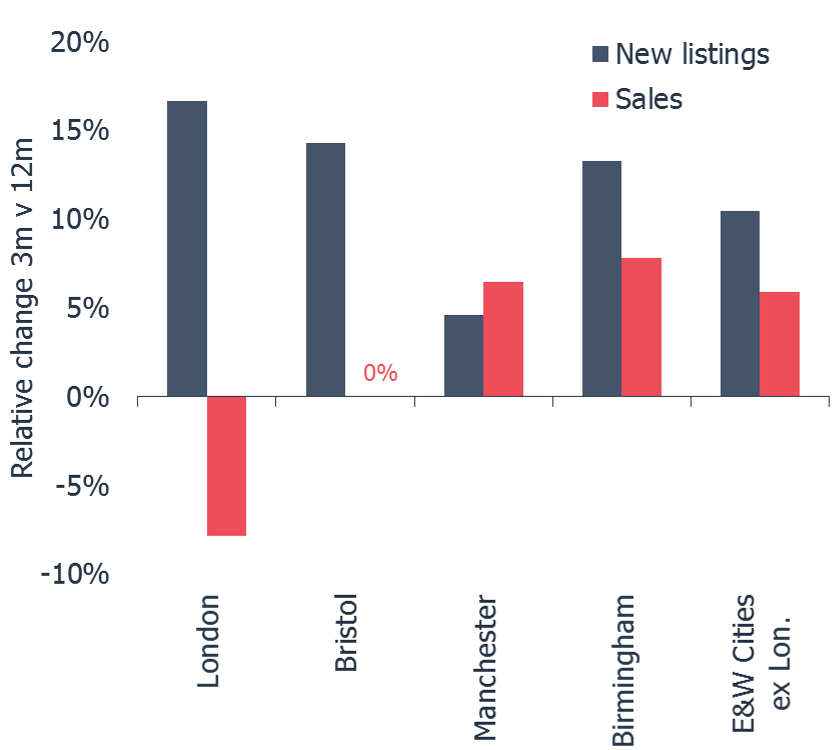
Figure 2 shows the relative change in new listings and sales for selected cities – it shows that new listings have grown faster in the last 3 months than the average increase in supply seen over the last 12 months. For all cities in England and Wales, excluding London, new listings have grown 10% faster than the 12 month average, this rises to over 15% in London.
In contrast, the relative change in sales over the last 3 months has registered a relative fall of 8% in London i.e. 8% fewer homes sold in the last 3 months compared to the 12 month average. The relative change in Bristol is 0%, while in larger regional cities, where house price growth has been picking up momentum, the relative change is sales is positive at up to 7% in Manchester.
Richard Donnell, Insight Director at Hometrack says: “The headwinds that were facing the London market in the lead up to the EU referendum have intensified on the back of the vote to leave and are resulting in slower sales rates. It is still early days, and seasonal factors are also in play but the growth in new listings and slower sales points to slower growth in the months ahead. This growth in supply reflects a mix of new homes filtering through from London’s expanded development pipeline, investors looking to take capital gains, or selling to de-leverage their investments following the reduction in tax relief on mortgage payments for buy-to let investors.
“In contrast, in many large regional cities, sales appear to have held up better thanks to a combination of much better housing affordability than in southern cities, improving economic growth and record low mortgage rates helping to stimulate demand.
Donnell concludes: “The reality is that it is still very early days to assess the true impact of the Brexit vote on the housing market. Our view remains that sales volumes are likely to slow and price growth will moderate over the second half of the year. The severity of a slowdown will depend upon the response of consumers and businesses to the uncertainty created by the decision to leave the EU and the impact this has on the economy. The early market activity data confirms our view that London will bear the brunt of any slowdown.
The Hometrack UK Cities House Price Index is Not Seasonally Adjusted
NOTE – The definition of London ‘City’ is larger than the London Government Region. The ‘City definition extends further out into London’s travel to work area capturing the commuter areas outside the 33 London Boroughs. The London ‘City’ area covers 44 local authorities and better represents the housing markets that are influenced by the London economy.
-ENDS-
About the Hometrack UK Cities House Price Index
The new Hometrack UK Cities House Price index has been designed to provide a granular analysis of housing market trends at a city level – cities are the focus for economic and demographic change as well as a focus for greater cross-area collaboration. The 20 cities in this new house price index cover a land area that is less than 5% of the UK but the cities contain over 40% of the value of UK housing and a similar proportion of all UK jobs. (See notes for more information on the index series.)
NOTES FOR EDITORS
1. Hometrack’s house price indices (HPI) are designed to track, as closely as possible, the performance of UK residential capital values over time. We have a track record of developing and running proprietary, localised, sub-regional house price indices for over a decade. Localised house price indices form a key part of the Hometrack automated valuation model where indexation is a key element of the valuation system. This valuation system is trusted by 4 of the top 5 lenders in the UK.
2. From October 2014, we are publishing a unique index based on 20 UK cities. We will also be producing indexes for the UK, Government Regions and the countries of Scotland, Wales and Northern Ireland. Interactive analysis, further information and FAQs on the index can be found at www.hometrack.com.
3. This new Hometrack UK Cities House Price Index is very different to our historic monthly housing survey which was an aggregation of the views of a large sample of agents and surveyors on key market trends in their local area. The survey has been dis-continued. Selected market metrics from the survey are being calculated from listings data and are available in Hometrack products and services.
4. The geographic definition of a city is based upon Primary Urban Areas – these cover the built up area of a city or a city region. Primary Urban Areas for English cities were defined in a report published by Government entitled The State of the English Cities Volume 1, ODPM, 2006. All cities are based upon amalgamations of single or multiple local authorities. The Primary Urban Area methodology has been applied to major cities across the rest of the UK covering Scotland, Wales and Northern Ireland.
5. Hometrack’s UK Cities House Price Index is created using a repeat sales based methodology drawing upon a large database comprising 100% of recorded sales prices from the Land Registry ‘Price Paid’ dataset and equivalent data from the Registers of Scotland. This price paid data is supplemented by mortgage valuation data.
6. The Hometrack UK Cities House Price Index is weighted according to the volume of private housing stock in each geographic area. The property type weightings are adjusted dynamically over time each quarter as the stock of housing grows, but the absolute changes are small.
7. The primary output of the UK Cities House Price Index build process is a monthly ‘multiplier’, the amount by which house prices have changed over the period based on the available evidence for the relevant geography. This monthly multiplier is used to create an index of house prices.
8. The Hometrack UK Cities House Price Index is revisionary i.e. there are revisions each month as more data comes available as sales are registered and further information becomes available. All UK house price indices are published on a revisionary basis. The scale of monthly revisions tends to be larger for smaller geographies where sales volumes are lower and indices can be more volatile at the leading edge. The historic revisions are minimal for the largest geographies.
9. The series are supplied on a non-seasonally adjusted basis.
10. In order to calculate the average price, the monthly price changes are applied to an average price to create a time series for average house prices from a base date which was in December 2013.
11. All average prices and percentage changes are expressed in nominal terms i.e. not adjusted for inflation.
12. Further information can be found at ww.hometrack.com
The latest Hometrack UK Cities Index reveals that in the three months to September house price inflation in London recorded the lowest quarterly growth for 20 months.
The latest Hometrack UK Cities Index reveals house price growth has fallen to 8.2% as the slowdown seen in cities across the south of England in recent months intensified in August.
London, Tuesday 13th September: Hometrack has been appointed by digital challenger bank, Atom, to provide a range of Automated Valuation Model (AVM) services.
The latest Hometrack UK Cities House Price Index reveals a marked slowdown in house price growth over the last three months, led by a deceleration in London and other high value cities across the south of England.

Subscribe to receive email updates.
HometrackGlobal:
Linked In: