Confirming payment details

Payment processing
Login or Sign up
Forgot password
Enter your email address and we will send you a password reset link or need more help?
March 2015 - Hometrack UK Cities House Price Index shows UK house prices in large regional cities outperform central London for the first time since 2005
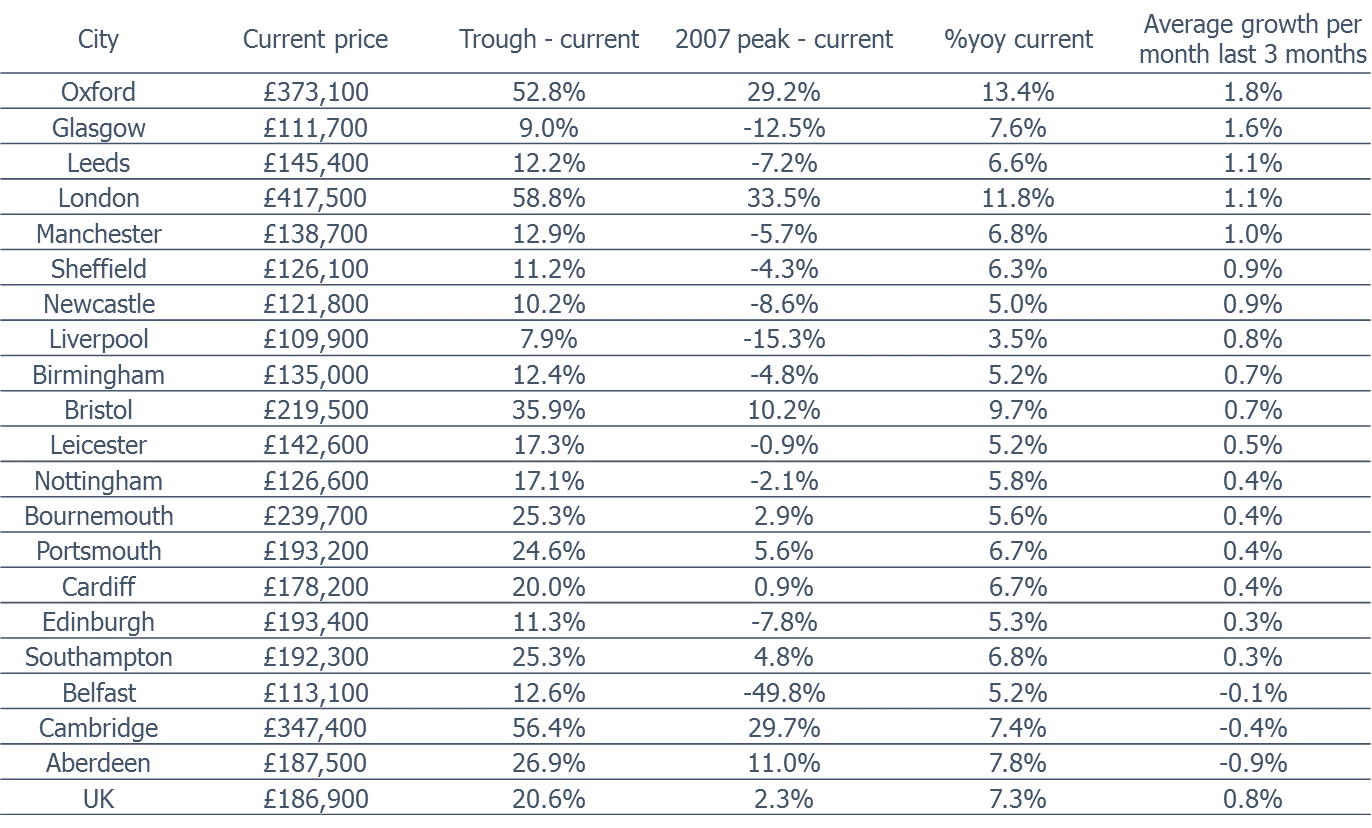
On 24 April, 2015- The average UK house price has grown by more than a fifth from its 2009 trough to £186,878, supported by a 59% increase in London
- Growth has slowed in Central London to just 3% and in Greater London by a third to 11.8%, but this enduring double digit growth is being sustained by lower value and relatively affordable markets
- Newham (14.2%), Barking and Dagenham (12.5%), Greenwich (12.4%), and Croydon (12.1%) are registering the highest rates of annual house price growth
- The average house price in Newham is now £275,887 - a third lower than the London average and approaching 50% higher than the UK average
- Newcastle (2.7%), Sheffield (2.7%), Manchester (3.0%), Leeds (3.3%) and Glasgow (4.8%) had the strongest quarters compared with Belfast (-0.3%), Cambridge (-1.2%) and Aberdeen (-2.7% ) which posted small falls
12 of the UK’s largest regional cities, including Glasgow (7.6%), Manchester (6.8%) and Leeds (6.6%) have registered higher price rises year on year than Central London. Some of the capital’s most valuable boroughs such as Kensington & Chelsea and Hammersmith & Fulham (3.4% and 5.1%) have decelerated amidst political uncertainty, the threat of mansion tax and affordability pressures.
London, 24 April 2015 – Central London recorded year ion year house price inflation of 3% in the first quarter of 2015 but the capital’s most expensive boroughs are being eclipsed by growth in large regional cities, residential analysts Hometrack revealed in its latest UK Cities House Price Index.
Newcastle, Sheffield, Manchester, Leeds and Glasgow registered the strongest pick up in house price growth in the first quarter of 2015 as households gain in confidence over the economic outlook and attracted by record low mortgage rates. Together these cities account for 30% of housing stock covered by the Hometrack index and this pick-up in growth is supporting the headline rate of house price growth.
Overall, UK house prices increased by 0.8% in the last quarter to March and by 20.6% relative to the 2009 trough. Average house prices across the 20 cities included in the Hometrack UK Cities Index registered growth of 3.8% in Q1 compared to 3% over the same period in 2014. While the UK picture is polarised by a North - South reversal in house price growth, the London market is divided by its East - West compass points.
The balance of house price growth across the Cities Index for London has shifted from high value markets driven by international capital to the lower value markets favoured by owner occupiers. Newham, Barking and Dagenham, Greenwich, and Croydon registered 14.2%, 12.5%, 12.4%, and 12.1% growth respectively in the last quarter compared to the same period 12 months ago. These boroughs are sustaining the capital’s growth, despite house prices in the affluent Central London areas of Kensington & Chelsea and Hammersmith & Fulham running at just 3.4% and 5.1% respectively.
Although house price gains in London’s outlying boroughs have registered off a lower base, they have been driven by savvy homeowners migrating away from the central London domain, which has been monopolised by international buyers. Areas of London that are still undergoing regeneration or are benefiting from new investment have proved popular with owner occupiers priced out of the boroughs favoured by international buyers and investors.
The highest year on year growth rate was recorded in Newham and Barking & Dagenham, where average house prices are £275,000 and £215,000 respectively, and track 33% and 50% below the London average of £417,000.
Richard Donnell, Director of Research at residential analysts Hometrack, said:
“House price growth is holding up better than expected as a result of a lack of new supply of homes for sale and record low mortgage rates attracting buyers into the market.
“Growth in London is still running in double digits and high capital growth rates in recent years have pushed down average loan to values in London, creating further capacity for additional borrowing for households that can pass tighter affordability tests for new lending.
“The pattern that we are currently seeing in regional cities is similar to what we witnessed in London from 2011 – 2013, except the majority of demand for housing in these cities is coming from domestic owner occupiers. It is not being boosted by international buyers or excess investor demand, as was the case in London, hence the more modest level of price rises compared to recent growth rates in the capital.
"As London’s first time buyers grapple over the affordability of the first rung on the property ladder, there is an opportunity to buy ahead of the curve. Boroughs such as Newham, Redbridge, Greenwich, and Barking and Dagenham offer that elusive mix of short term affordability and good capital growth in the longer term.”

The Hometrack UK Cities House Price Index is Not Seasonally Adjusted
NOTE – The definition of London ‘City’ is larger than the London Government Region. The ‘City definition extends further out into London’s travel to work area capturing the commuter areas outside the 33 London Boroughs. The London ‘City’ area covers 44 local authorities and better represents the housing markets that are influenced by the London economy.
-ENDS-
About the Hometrack UK Cities House Price Index
The new Hometrack UK Cities House Price index has been designed to provide a granular analysis of housing market trends at a city level – cities are the focus for economic and demographic change as well as a focus for greater cross-area collaboration. The 20 cities in this new house price index cover a land area that is less than 5% of the UK but the cities contain over 40% of the value of UK housing and a similar proportion of all UK jobs. (See notes for more information on the index series.)
NOTES FOR EDITORS
1. Hometrack’s house price indices (HPI) are designed to track, as closely as possible, the performance of UK residential capital values over time. We have a track record of developing and running proprietary, localised, sub-regional house price indices for over a decade. Localised house price indices form a key part of the Hometrack automated valuation model where indexation is a key element of the valuation system. This valuation system is trusted by 4 of the top 5 lenders in the UK.
2. From October 2014, we are publishing a unique index based on 20 UK cities. We will also be producing indexes for the UK, Government Regions and the countries of Scotland, Wales and Northern Ireland. Interactive analysis, further information and FAQs on the index can be found at www.hometrack.com.
3. This new Hometrack UK Cities House Price Index is very different to our historic monthly housing survey which was an aggregation of the views of a large sample of agents and surveyors on key market trends in their local area. The survey has been dis-continued. Selected market metrics from the survey are being calculated from listings data and are available in Hometrack products and services.
4. The geographic definition of a city is based upon Primary Urban Areas – these cover the built up area of a city or a city region. Primary Urban Areas for English cities were defined in a report published by Government entitled The State of the English Cities Volume 1, ODPM, 2006. All cities are based upon amalgamations of single or multiple local authorities. The Primary Urban Area methodology has been applied to major cities across the rest of the UK covering Scotland, Wales and Northern Ireland.
5. Hometrack’s UK Cities House Price Index is created using a repeat sales based methodology drawing upon a large database comprising 100% of recorded sales prices from the Land Registry ‘Price Paid’ dataset and equivalent data from the Registers of Scotland. This price paid data is supplemented by mortgage valuation data.
6. The Hometrack UK Cities House Price Index is weighted according to the volume of private housing stock in each geographic area. The property type weightings are adjusted dynamically over time each quarter as the stock of housing grows, but the absolute changes are small.
7. The primary output of the UK Cities House Price Index build process is a monthly ‘multiplier’, the amount by which house prices have changed over the period based on the available evidence for the relevant geography. This monthly multiplier is used to create an index of house prices.
8. The Hometrack UK Cities House Price Index is revisionary i.e. there are revisions each month as more data comes available as sales are registered and further information becomes available. All UK house price indices are published on a revisionary basis. The scale of monthly revisions tends to be larger for smaller geographies where sales volumes are lower and indices can be more volatile at the leading edge. The historic revisions are minimal for the largest geographies.
9. The series are supplied on a non-seasonally adjusted basis.
10. In order to calculate the average price, the monthly price changes are applied to an average price to create a time series for average house prices from a base date which was in December 2013.
11. All average prices and percentage changes are expressed in nominal terms i.e. not adjusted for inflation.
12. Further information can be found at ww.hometrack.com
The latest Hometrack UK Cities Index reveals that in the three months to September house price inflation in London recorded the lowest quarterly growth for 20 months.
The latest Hometrack UK Cities Index reveals house price growth has fallen to 8.2% as the slowdown seen in cities across the south of England in recent months intensified in August.
London, Tuesday 13th September: Hometrack has been appointed by digital challenger bank, Atom, to provide a range of Automated Valuation Model (AVM) services.
The latest Hometrack UK Cities House Price Index reveals a marked slowdown in house price growth over the last three months, led by a deceleration in London and other high value cities across the south of England.

Subscribe to receive email updates.
HometrackGlobal:
Linked In: