Confirming payment details

Payment processing
Login or Sign up
Forgot password
Enter your email address and we will send you a password reset link or need more help?
May 2015 Hometrack UK Cities House Price Index: Seven Cities in the South of England Outperform Annual Average UK House Price Growth of £11,500
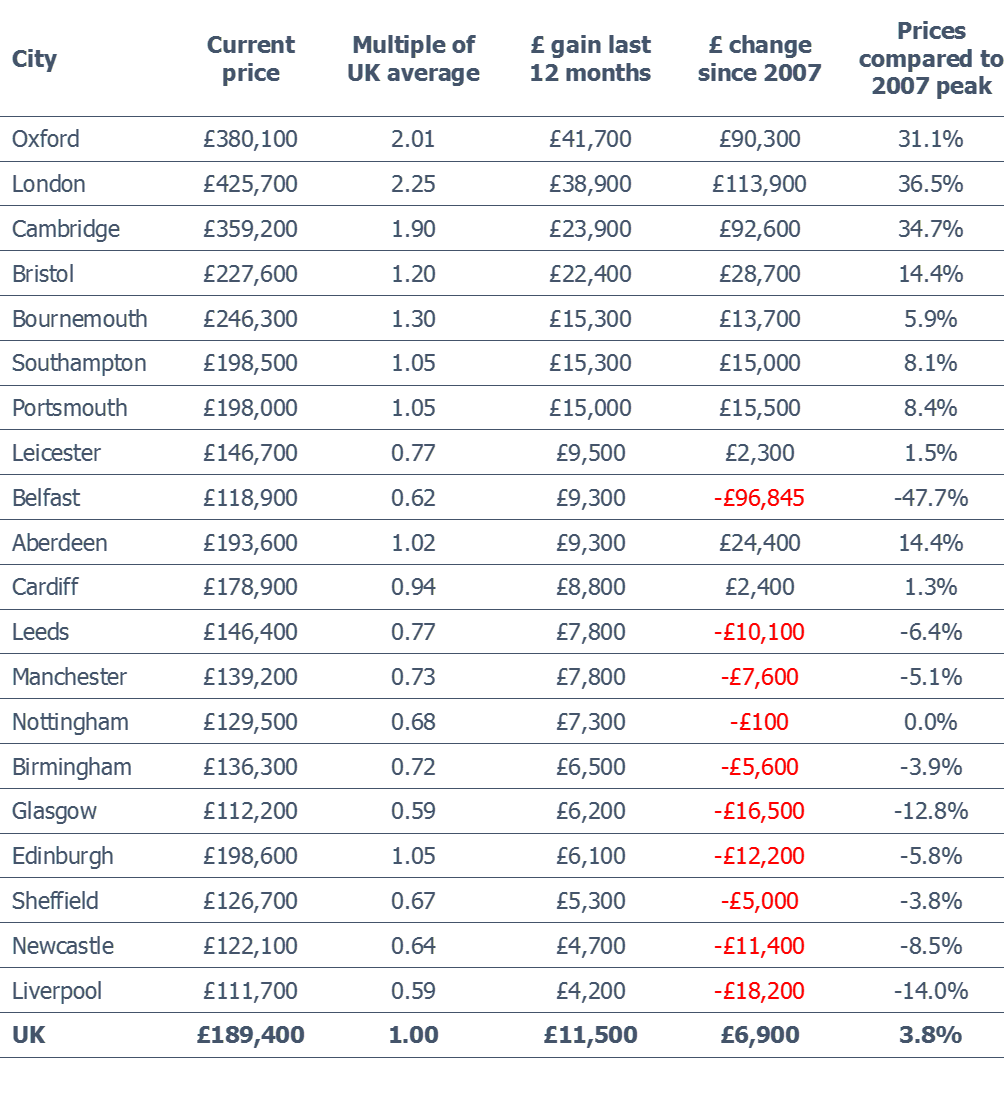
On 26 June, 2015- UK house prices increased by 0.8% in May to £189,400, which is 3.8% above the 2007 peak
- 11 out of the 20 cities covered by the Index have now surpassed the 2007 peak with London (36.5%), Cambridge (34.7%) and Oxford (31.1%) leading the pack
- The cities furthest from their peak are Belfast (-47.7%), Liverpool (-14%) and Glasgow (-12.8%)
- However, all cities showed notable monetary gains over the last 12 months ranging from £4,200 in Liverpool to £41,700 in Oxford
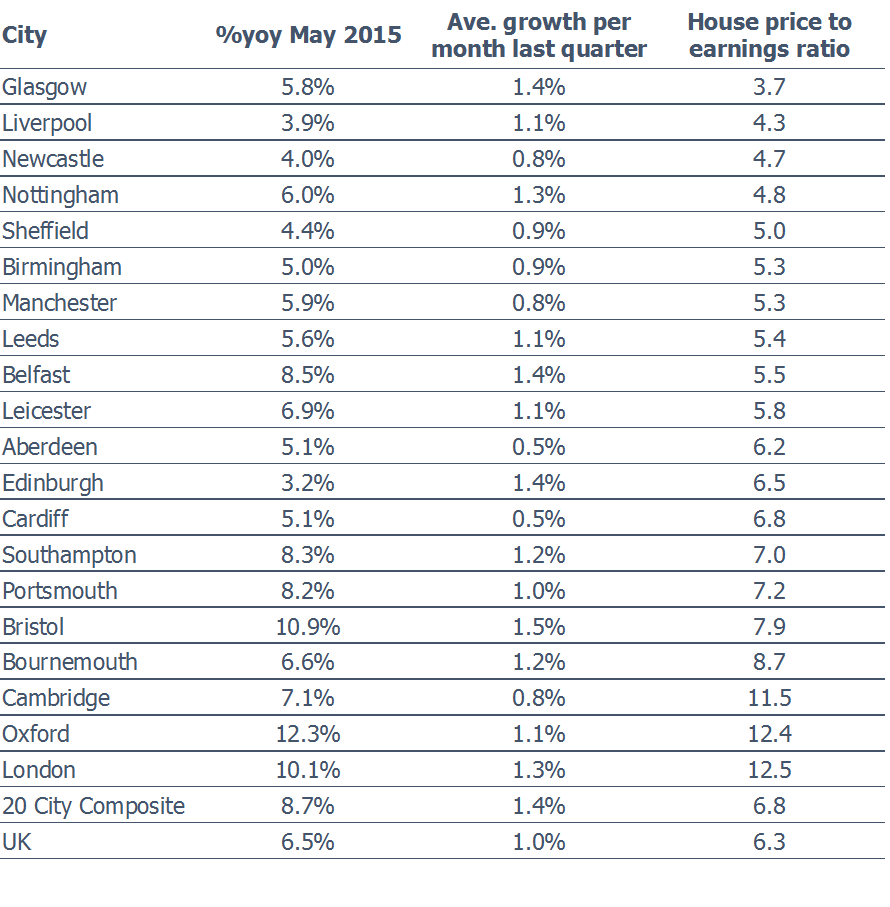
- Bristol continues to exhibit the fastest month-on-month acceleration in prices with a 1.3% gain in May
Oxford leads the Index of 20 cities in annual house price growth with an increase that is nearly 10 times greater than that exhibited by Liverpool at the bottom of the table. Hometrack attributes gains in southern cities to robust demand for housing underpinned by strong local economies.
London, 26 June 2015 – UK house prices have increased by an average of £11,500 over the last 12 months to May 2015 with seven cities in the South of England significantly outperforming this benchmark, residential analyst Hometrack has revealed in its latest UK Cities House Price Index. The average UK house now costs £189,400 with London more than double this figure at £425,700.
Oxford has recorded the highest monetary gains in the last 12 months of £41,700 nearly quadruple the UK average of £11,500 followed by London (£38,900), Cambridge (£23,900), Bristol (£22,400), Southampton (£15,300), Bournemouth (£15,300) and Portsmouth (£15,000). These gains are a result of robust demand underpinned by the strength of these cities’ local economies.
All 20 cities recorded gains in the last 12 months, but three Northern cities fared the worst adding less than half the UK average to house prices. Liverpool (£4,200), Newcastle (£4,700) and Sheffield (£5,300) are still 14%, 8.5% and 3.8% below their 2007 peak and are part of a group of nine cities in the North of England, Scotland and North Ireland that are recovering at a much slower pace due to weaker demand from house buyers.
All cities except one – Aberdeen which saw -0.4% loss – exhibited month-on-month gains in May, which can be attributed in part to a post-election bounce. Bristol led the way with a 1.3% increase followed closely by a mixed bag of cities Cambridge, Leicester, Liverpool and Belfast with 1.2%.
Richard Donnell, Director of Research at residential analysts Hometrack, said:
“House prices have picked up momentum post-election. An increasing proportion of households are feeling the benefits of the improving economy, which means that house price growth is set to continue in the coming months. The greatest risk is an earlier than expected increase in interest rates which would knock market sentiment.
“The strong demand-side recovery seen in southern England has yet to spread to other cities revealing the diverse nature of the housing market. All cities are making gains at different rates of growth, but the cities with the biggest increases all have something in common – strong local economies.
“Affordability pressures will bite at some point in the high value, high growth markets. The double digit price growth registered in cities such as London, Oxford and Cambridge is being sustained by a lack of supply and below average transaction volumes with a third of sales funded by cash or buy to let mortgages. London has the highest price to earnings ratio, but it covers a wide range of sub-markets. Over the last 3 years, the impetus for house price growth has shifted from prime markets to the more affordable markets in outer London and the commuter belt.”
The Hometrack UK Cities House Price Index is Not Seasonally Adjusted
NOTE – The definition of London ‘City’ is larger than the London Government Region. The ‘City definition extends further out into London’s travel to work area capturing the commuter areas outside the 33 London Boroughs. The London ‘City’ area covers 44 local authorities and better represents the housing markets that are influenced by the London economy.
-ENDS-
About the Hometrack UK Cities House Price Index
The new Hometrack UK Cities House Price index has been designed to provide a granular analysis of housing market trends at a city level – cities are the focus for economic and demographic change as well as a focus for greater cross-area collaboration. The 20 cities in this new house price index cover a land area that is less than 5% of the UK but the cities contain over 40% of the value of UK housing and a similar proportion of all UK jobs. (See notes for more information on the index series.)
NOTES FOR EDITORS
1. Hometrack’s house price indices (HPI) are designed to track, as closely as possible, the performance of UK residential capital values over time. We have a track record of developing and running proprietary, localised, sub-regional house price indices for over a decade. Localised house price indices form a key part of the Hometrack automated valuation model where indexation is a key element of the valuation system. This valuation system is trusted by 4 of the top 5 lenders in the UK.
2. From October 2014, we are publishing a unique index based on 20 UK cities. We will also be producing indexes for the UK, Government Regions and the countries of Scotland, Wales and Northern Ireland. Interactive analysis, further information and FAQs on the index can be found at www.hometrack.com.
3. This new Hometrack UK Cities House Price Index is very different to our historic monthly housing survey which was an aggregation of the views of a large sample of agents and surveyors on key market trends in their local area. The survey has been dis-continued. Selected market metrics from the survey are being calculated from listings data and are available in Hometrack products and services.
4. The geographic definition of a city is based upon Primary Urban Areas – these cover the built up area of a city or a city region. Primary Urban Areas for English cities were defined in a report published by Government entitled The State of the English Cities Volume 1, ODPM, 2006. All cities are based upon amalgamations of single or multiple local authorities. The Primary Urban Area methodology has been applied to major cities across the rest of the UK covering Scotland, Wales and Northern Ireland.
5. Hometrack’s UK Cities House Price Index is created using a repeat sales based methodology drawing upon a large database comprising 100% of recorded sales prices from the Land Registry ‘Price Paid’ dataset and equivalent data from the Registers of Scotland. This price paid data is supplemented by mortgage valuation data.
6. The Hometrack UK Cities House Price Index is weighted according to the volume of private housing stock in each geographic area. The property type weightings are adjusted dynamically over time each quarter as the stock of housing grows, but the absolute changes are small.
7. The primary output of the UK Cities House Price Index build process is a monthly ‘multiplier’, the amount by which house prices have changed over the period based on the available evidence for the relevant geography. This monthly multiplier is used to create an index of house prices.
8. The Hometrack UK Cities House Price Index is revisionary i.e. there are revisions each month as more data comes available as sales are registered and further information becomes available. All UK house price indices are published on a revisionary basis. The scale of monthly revisions tends to be larger for smaller geographies where sales volumes are lower and indices can be more volatile at the leading edge. The historic revisions are minimal for the largest geographies.
9. The series are supplied on a non-seasonally adjusted basis.
10. In order to calculate the average price, the monthly price changes are applied to an average price to create a time series for average house prices from a base date which was in December 2013.
11. All average prices and percentage changes are expressed in nominal terms i.e. not adjusted for inflation.
12. Further information can be found at ww.hometrack.com
The latest Hometrack UK Cities Index reveals that in the three months to September house price inflation in London recorded the lowest quarterly growth for 20 months.
The latest Hometrack UK Cities Index reveals house price growth has fallen to 8.2% as the slowdown seen in cities across the south of England in recent months intensified in August.
London, Tuesday 13th September: Hometrack has been appointed by digital challenger bank, Atom, to provide a range of Automated Valuation Model (AVM) services.
The latest Hometrack UK Cities House Price Index reveals a marked slowdown in house price growth over the last three months, led by a deceleration in London and other high value cities across the south of England.

Subscribe to receive email updates.
HometrackGlobal:
Linked In: