Confirming payment details

Payment processing
Login or Sign up
Forgot password
Enter your email address and we will send you a password reset link or need more help?
October 2015 UK Cities Index - City level house price inflation on track for 10% growth in 2015 as price growth accelerates in large regional cities
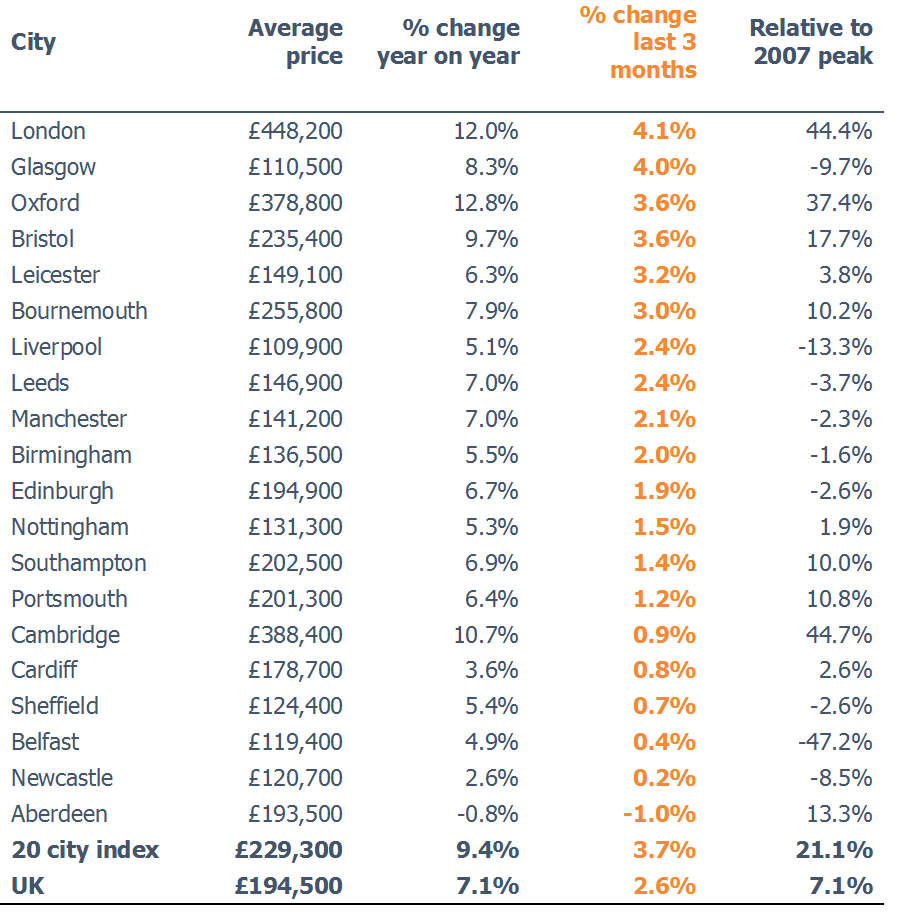
On 20 November, 2015- City level house price inflation currently running at 9.4% - with an average price of £229,300
- City house price growth set to reach 10% by the year end
- Glasgow (8.3%), Manchester (7.0%) and Liverpool (5.1%) are currently recording their highest rates of annual house price growth since 2007
London, 20 November 2015 – Hometrack’s UK Cities House Price Index has recorded annual house price growth of 9.4% per annum, and looks set to reach 10% by the year end.
The large regional cities outside southern England are recording an acceleration in growth off a low base. Glasgow (up 8.3%), Manchester (up 7%) and Liverpool (up 5.1%) are registering the highest rates of annual house price growth since 2007.
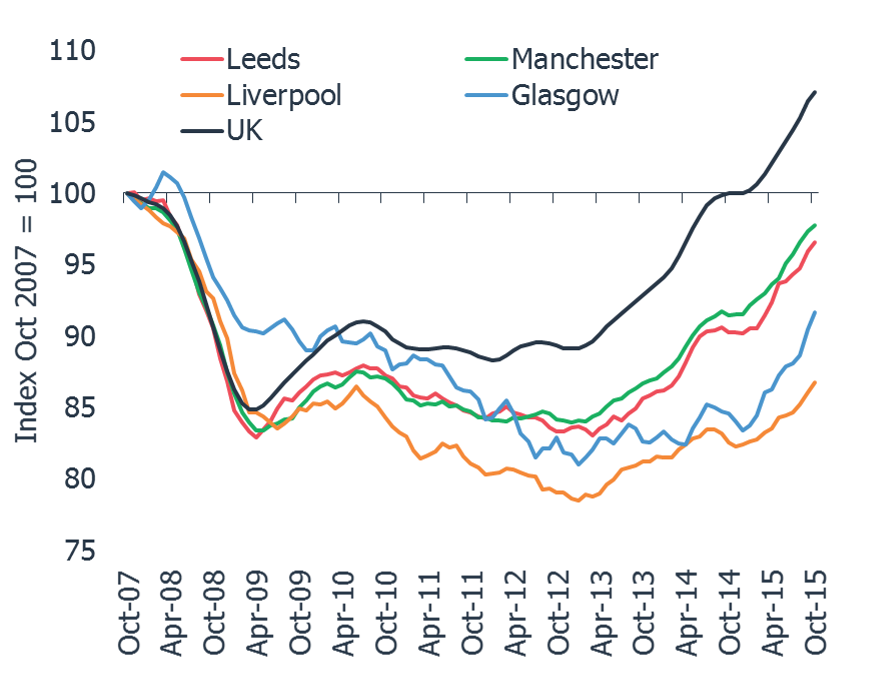
- Glasgow house prices currently average £110,000, less than half the £229,300 average price across all the 20 cities measured by the Hometrack UK Cities index. House prices in Glasgow stopped falling three years ago and have since risen by 13%. In the last 12 months they are up by 8.3%, the highest rate of growth since August 2007.
- Manchester house prices have been recovering since 2012 and average house prices have risen by 17% over this time to £141,200. In the last 12 months house prices across Manchester have grown by 7.0% - the highest rate of growth since July 2007.
- Liverpool has registered the weakest house price performance of all the British cities covered by the index. House prices declined between 2007 and early 2013 and have since increased by 10.5%. In the last 12 months the rate of growth has risen to 5.1%, the highest since August 2007. Despite this modest recovery, the average price of £109,800 is still 13% lower than the 2007 peak.
The recovery emerging in large regional cities contrasts strongly with the rise of London’s house prices where average values are up by 70% since 2009 (and by over 100% in the highest value markets in central London). It is these high value markets that are now recording some of the weakest levels of house price growth (Kensington and Chelsea -2.6%, City of Westminster +1.3%) as tax and currency changes impact demand after a period of stellar price appreciation.
Richard Donnell, Director of Research at residential analysts Hometrack, said:
“Improving consumer confidence and low mortgage rates are boosting demand in cities where the recovery in house prices is in its infancy. While southern cities have been in recovery mode for over 6 years with price gains of up to 70%, the large regional cities have seen far more modest price rises over just the last 3 years.
“Further house price growth is likely to improve market confidence as it pushes down loan to values on mortgaged homes and creates capacity for households to access cheaper credit. Many corporate investors and developers are looking to the major regional cities in search of better value for money in new investments relative to London.
“The outlook for the next 12 to 18 months will be a balance between how much the high growth cities slow on affordability pressures and how much more momentum will come from cities where the pick-up in house prices is just beginning to pick up.”
The Hometrack UK Cities House Price Index is Not Seasonally Adjusted
NOTE – The definition of London ‘City’ is larger than the London Government Region. The ‘City definition extends further out into London’s travel to work area capturing the commuter areas outside the 33 London Boroughs. The London ‘City’ area covers 44 local authorities and better represents the housing markets that are influenced by the London economy.
-ENDS-
About the Hometrack UK Cities House Price Index
The new Hometrack UK Cities House Price index has been designed to provide a granular analysis of housing market trends at a city level – cities are the focus for economic and demographic change as well as a focus for greater cross-area collaboration. The 20 cities in this new house price index cover a land area that is less than 5% of the UK but the cities contain over 40% of the value of UK housing and a similar proportion of all UK jobs. (See notes for more information on the index series.)
NOTES FOR EDITORS
1. Hometrack’s house price indices (HPI) are designed to track, as closely as possible, the performance of UK residential capital values over time. We have a track record of developing and running proprietary, localised, sub-regional house price indices for over a decade. Localised house price indices form a key part of the Hometrack automated valuation model where indexation is a key element of the valuation system. This valuation system is trusted by 4 of the top 5 lenders in the UK.
2. From October 2014, we are publishing a unique index based on 20 UK cities. We will also be producing indexes for the UK, Government Regions and the countries of Scotland, Wales and Northern Ireland. Interactive analysis, further information and FAQs on the index can be found at www.hometrack.com.
3. This new Hometrack UK Cities House Price Index is very different to our historic monthly housing survey which was an aggregation of the views of a large sample of agents and surveyors on key market trends in their local area. The survey has been dis-continued. Selected market metrics from the survey are being calculated from listings data and are available in Hometrack products and services.
4. The geographic definition of a city is based upon Primary Urban Areas – these cover the built up area of a city or a city region. Primary Urban Areas for English cities were defined in a report published by Government entitled The State of the English Cities Volume 1, ODPM, 2006. All cities are based upon amalgamations of single or multiple local authorities. The Primary Urban Area methodology has been applied to major cities across the rest of the UK covering Scotland, Wales and Northern Ireland.
5. Hometrack’s UK Cities House Price Index is created using a repeat sales based methodology drawing upon a large database comprising 100% of recorded sales prices from the Land Registry ‘Price Paid’ dataset and equivalent data from the Registers of Scotland. This price paid data is supplemented by mortgage valuation data.
6. The Hometrack UK Cities House Price Index is weighted according to the volume of private housing stock in each geographic area. The property type weightings are adjusted dynamically over time each quarter as the stock of housing grows, but the absolute changes are small.
7. The primary output of the UK Cities House Price Index build process is a monthly ‘multiplier’, the amount by which house prices have changed over the period based on the available evidence for the relevant geography. This monthly multiplier is used to create an index of house prices.
8. The Hometrack UK Cities House Price Index is revisionary i.e. there are revisions each month as more data comes available as sales are registered and further information becomes available. All UK house price indices are published on a revisionary basis. The scale of monthly revisions tends to be larger for smaller geographies where sales volumes are lower and indices can be more volatile at the leading edge. The historic revisions are minimal for the largest geographies.
9. The series are supplied on a non-seasonally adjusted basis.
10. In order to calculate the average price, the monthly price changes are applied to an average price to create a time series for average house prices from a base date which was in December 2013.
11. All average prices and percentage changes are expressed in nominal terms i.e. not adjusted for inflation.
12. Further information can be found at ww.hometrack.com
The latest Hometrack UK Cities Index reveals that in the three months to September house price inflation in London recorded the lowest quarterly growth for 20 months.
The latest Hometrack UK Cities Index reveals house price growth has fallen to 8.2% as the slowdown seen in cities across the south of England in recent months intensified in August.
London, Tuesday 13th September: Hometrack has been appointed by digital challenger bank, Atom, to provide a range of Automated Valuation Model (AVM) services.
The latest Hometrack UK Cities House Price Index reveals a marked slowdown in house price growth over the last three months, led by a deceleration in London and other high value cities across the south of England.

Subscribe to receive email updates.
HometrackGlobal:
Linked In: