Confirming payment details

Payment processing
Login or Sign up
Forgot password
Enter your email address and we will send you a password reset link or need more help?
September 2016 Hometrack UK Cities: London records lowest quarterly growth for 20 months
On 20 October, 2016- London house price growth in the last quarter at its weakest since fears of a mansion tax and house price bubble gripped market at the end of 2014
- Annual UK city house price inflation remains stable at 8.5%, compared to 5.7% a year ago
- House price inflation continues to run at more than three times the growth in earnings
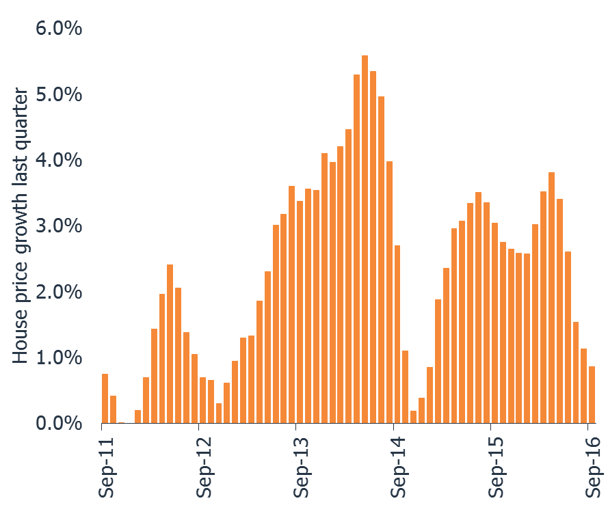
The latest Hometrack UK Cities Index reveals that in the three months to September house price inflation in London recorded the lowest quarterly growth for 20 months.
Average house price growth over the last three months to September totaled 0.9% (Fig 1). This is the lowest quarterly growth rate since January 2015 when fears of a potential housing bubble, a tightening of mortgage credit and concerns over the introduction of a mansion taxed gripped the market. Today, stretched affordability levels and new taxes for investors are impacting demand while supply continues to grow, reducing the upward pressure on house prices in London.
The overall headline rate of inflation for the UK Cities House Price Index has remained steady month-on-month with the annual rate of growth in September reaching 8.5%, compared to 5.7% 12 months ago. Residential values across major UK Cities (8.5%) are also experiencing a higher rate of growth than the overall UK where house prices are rising at 7.2% year-on-year (Figure 2).
Despite the ongoing uncertainty surrounding the terms of Britain’s exit from the European Union, house price inflation continues to run more than three times faster than the growth in earnings. This is down to improved household confidence, earnings rising ahead of inflation and low mortgage rates making housing affordable for those with equity.
Eleven of the 20 cities that form part of the Index have seen house prices continue to accelerate over 2016, typically large regional cities outside the south east - Manchester, Liverpool, Birmingham and Cardiff. In these markets affordability remains attractive and prices are rising off a low base.
However, the remaining nine cities are registering house price growth that is lower than it was at the start of 2016 with the greatest reduction seen in Cambridge, Oxford, London and Aberdeen.
This pattern is re-enforced by an analysis of property listings and sales data which shows that in large northern cities where prices are rising market activity remains strong. Sales rates are close to matching the flow of new property to the market, creating scarcity and supporting house price growth.
In contrast, London has the weakest market conditions with the new supply of homes coming to the market growing faster than sales, which have fallen back in recent months on weaker demand. The ratio of sales to new supply is at its highest level for three years, re-enforcing the outlook for a continued slowdown in the rate of house price growth across London in the months ahead.
Richard Donnell, Insight Director at Hometrack says: “In the immediate aftermath of the vote to leave the EU there was little obvious impact on the housing market and the rate of house price growth. Three months on and it is becoming clearer that households in large regional cities outside southern England continue to feel confident in buying homes and taking advantage of record low mortgage rates where affordability remains attractive for those with equity. In London market conditions are the opposite and new taxes are hitting investor demand while home owners face stretched affordability levels which are combining to slow the rate of house price growth.”
Please go to the latest UK Cities Index for the extensive report.
The latest Hometrack UK Cities Index reveals house price growth has fallen to 8.2% as the slowdown seen in cities across the south of England in recent months intensified in August.
London, Tuesday 13th September: Hometrack has been appointed by digital challenger bank, Atom, to provide a range of Automated Valuation Model (AVM) services.
The latest Hometrack UK Cities House Price Index reveals a marked slowdown in house price growth over the last three months, led by a deceleration in London and other high value cities across the south of England.
The latest Hometrack UK Cities House Price Index reveals that annual house price inflation plateaued at 10.2% in June, the same level as May 2016, but still ahead of 6.9% growth seen in June 2015.

Subscribe to receive email updates.
HometrackGlobal:
Linked In: