Confirming payment details

Payment processing
Login or Sign up
Forgot password
Enter your email address and we will send you a password reset link or need more help?
August 2016 - City level house price growth running at 8.2%
On 23 September, 2016- City level house price growth running at 8.2% as growth slows, led by southern cities
- London house price growth on course to end year at +6% yoy but with slower underlying rate.
- Cities with shortest recovery registering fastest growth in last quarter – Liverpool and Glasgow.
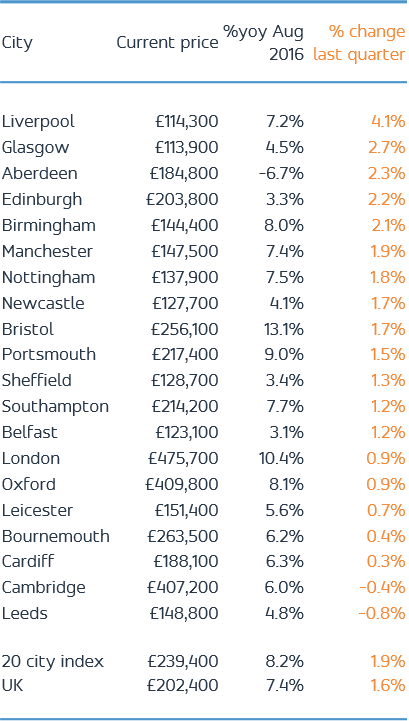
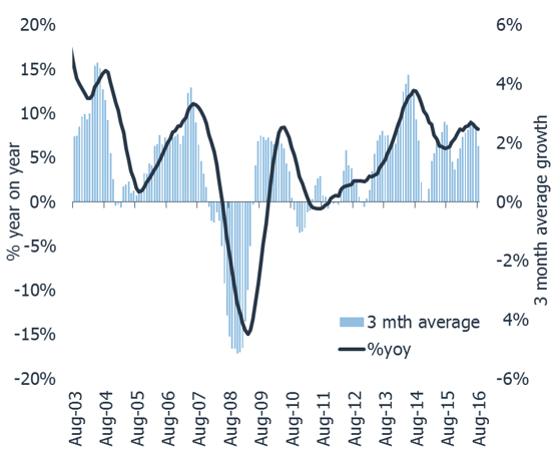
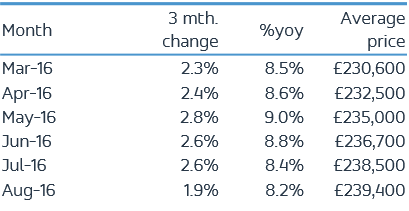
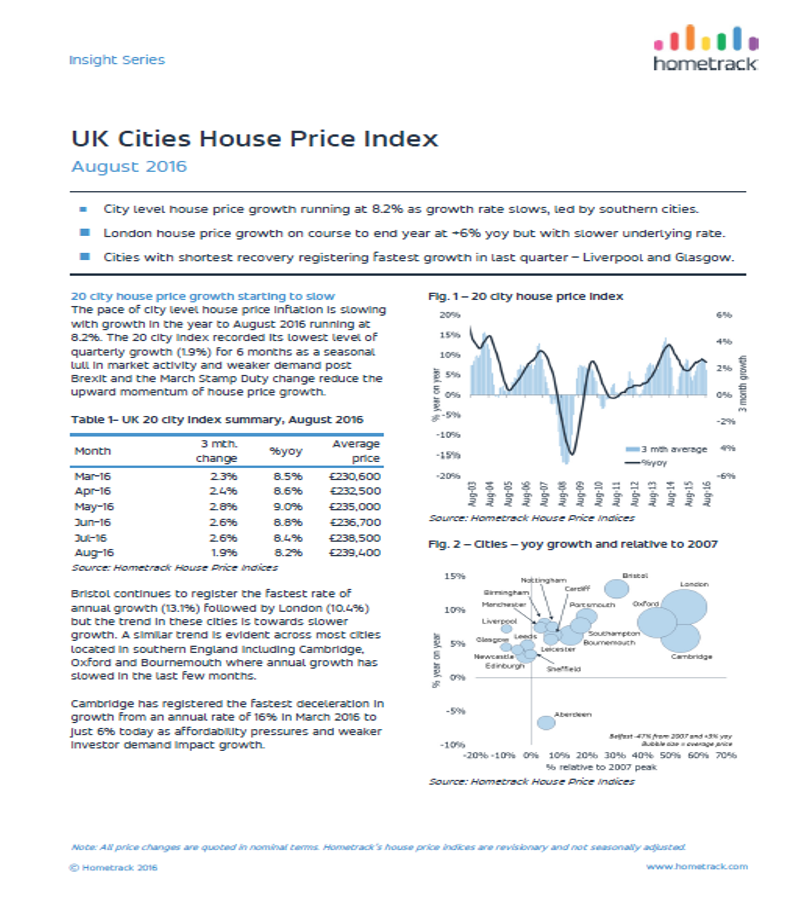
The pace of city level house price inflation is slowing with growth in the year to August 2016 running at 8.2%. The 20 city index recorded its lowest level of quarterly growth (1.9%) for 6 months as a seasonal lull in market activity and weaker demand post Brexit and the March Stamp Duty change reduce the upward momentum of house price growth
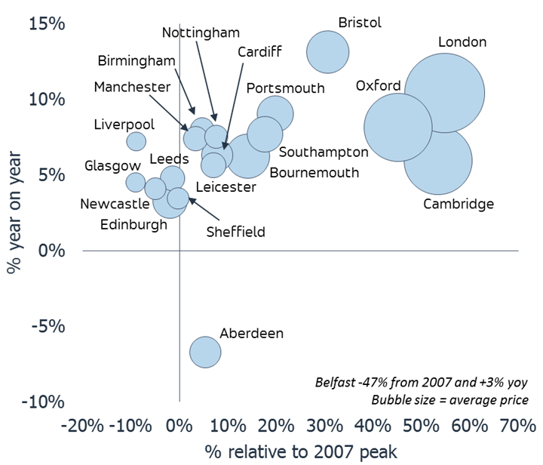
Bristol continues to register the fastest rate of annual growth (13.1%) followed by London (10.4%) but the trend in these cities is towards slower growth. A similar trend is evident across most cities located in southern England including Cambridge, Oxford and Bournemouth where annual growth has slowed in the last few months.
Cambridge has registered the fastest deceleration in growth from an annual rate of 16% in March 2016 to just 6% today as affordability pressures and weaker investor demand impact growth.
London growth heading to 6% by year end
London has registered a modest 0.9% increase in house prices over the last three months, more than half the average quarterly growth rate over the last 12 months (1.9%) – if this trend continues, as seems highly likely, then house price growth in the capital will be running at c.6% per annum by the year end and on course for low single digit growth by spring 2017. Record unaffordability, tax changes that impact investor demand and high stamp duty costs are all combining to reduce market activity in the face of rising supply.
Inner London has lowest growth and recent falls
A more granular view on London reveals the lowest rates of annual growth in the highest value, inner London boroughs - Kensington & Chelsea (0.2%), Hammersmith and Fulham (1.0%), Westminster (1.8%), Wandsworth (4.1%) and Camden (4.4%). Most of these areas have been registering small price falls over recent months and further single digit falls are likely in the months ahead as pricing levels re-align to what buyers are prepared to pay.
London not a single housing market
It is dangerous to view London as a single housing market - the highest rates of house price growth remain in the outer London boroughs of Barking and Dagenham (16.2%) and Havering (14.6%) where average house prices are 30% lower than the London average. Affordability is running out fast in these markets which have significantly out-performed central London for the last 2 years and single digit growth awaits in the months ahead.
Liverpool sees fastest growth in last 3 months
While house prices in London and other southern cities have been rising consistently for approaching 8 years, supported by strong investor demand and low mortgage rates, there are several cities where the recovery has been more short-lived. The city housing markets with the strongest underlying rates of growth remain those that have some of the lowest prices and where the pick-up in prices has been running for the shortest period of time. Liverpool and Glasgow have recorded the fastest growth in the last three months where average house prices of £114,000 are around half the price of the 20 city average (£239,400).
Aberdeen price falls starting to reverse
Other regional cities such as Birmingham, Edinburgh and Aberdeen have posted house price increases of more than 2% in the last quarter, all above the 20 city average over the same period (1.9%). This something of a turnaround for Aberdeen where average prices fell by £20,000 or 10% since July 2015 but where they have rebounded in the last quarter now the impact of the falling oil prices has been priced into capital values.
August 2016 - City level house price growth running at 8.2%
Related articles
City level house price growth is holding steady at 8.4%. This month we reveal an updated view on city level affordability. This finds that after an 86% uplift in house prices since 2009, the price to earnings ratio in London now sits above 14x with Oxford and Cambridge close behind. Other cities are at or below their long run average. Read the Report to find out what this means for city level house price inflation.
City level house price growth is running at 8.5% but growth in London has slowed rapidly in the last quarter to the lowest level of quarterly growth for 20 months. Eleven cities are registering higher growth than at the start of 2016 while 9 are slowing.
The annual rate of house price inflation across the 20 cities has started to slow after 12 successive months of rising house price inflation A marked slowdown in the rate of growth over the last three months in London is behind the shift in momentum. However, house price growth in large regional cities outside southern England, continues to hold steady at 7-8% per annum with no sign of an imminent slowdown. Aberdeen is also registering a slower rate of price falls compared to recent months.
It is still very early days to assess the true impact of the EU referendum vote on activity and house prices. Hometrack's view, based on our Cities Index and analysis of listings data, remains that sales volumes are likely to slow and price growth will moderate over the second half of the year.

Subscribe to receive email updates.
HometrackGlobal:
Linked In: