Confirming payment details

Payment processing
Login or Sign up
Forgot password
Enter your email address and we will send you a password reset link or need more help?
June 2016 - Sales volumes likely to slow with price growth moderating post Brexit
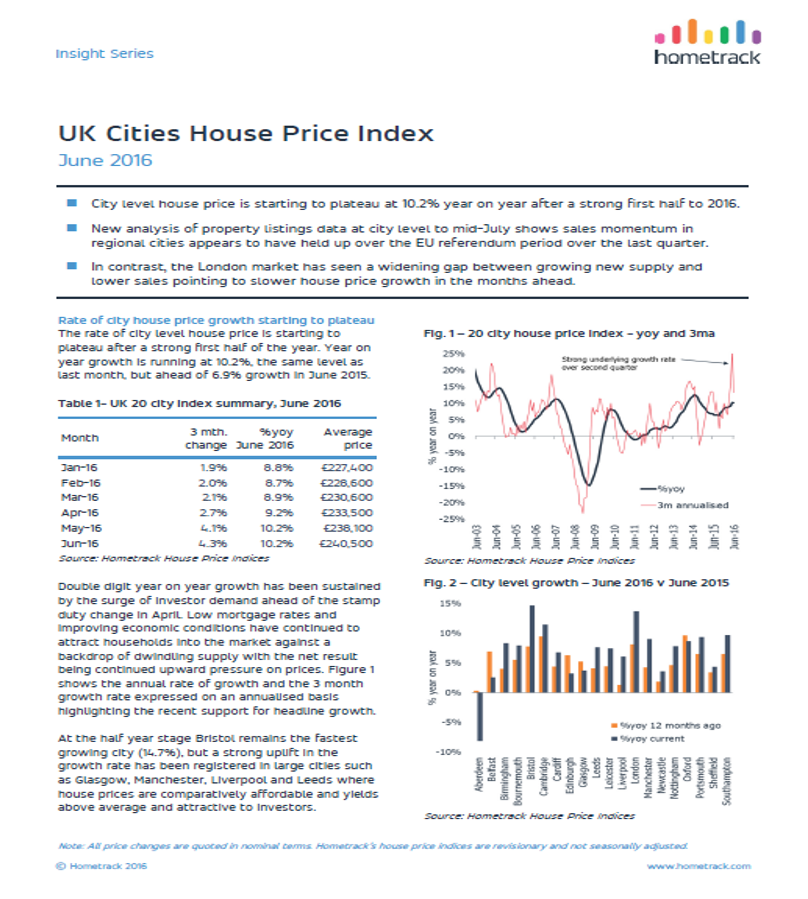
On 22 July, 2016- City level house price is starting to plateau at 10.2% year on year after a strong first half to 2016
- New analysis of property listings data at city level to mid-July shows sales momentum in regional cities appears to have held up over the EU referendum period over the last quarter.
- In contrast, the London market has seen a widening gap between growing new supply and lower sales pointing to slower house price growth in the months ahead.
It is still very early days to assess the true impact of the EU referendum vote on activity and house prices. Hometrack's view, based on our Cities Index and analysis of listings data, remains that sales volumes are likely to slow and price growth will moderate over the second half of the year.
Rate of city house price growth starting to plateau
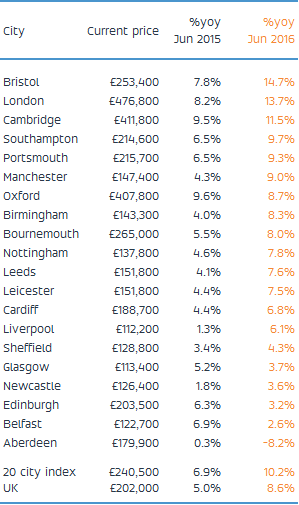
The rate of city level house price is starting to plateau after a strong first half of the year. Year on year growth is running at 10.2%, the same level as last month, but ahead of 6.9% growth in June 2015.
Table 1- UK 20 city index summary, June 2016

Source: Hometrack House Price Indices
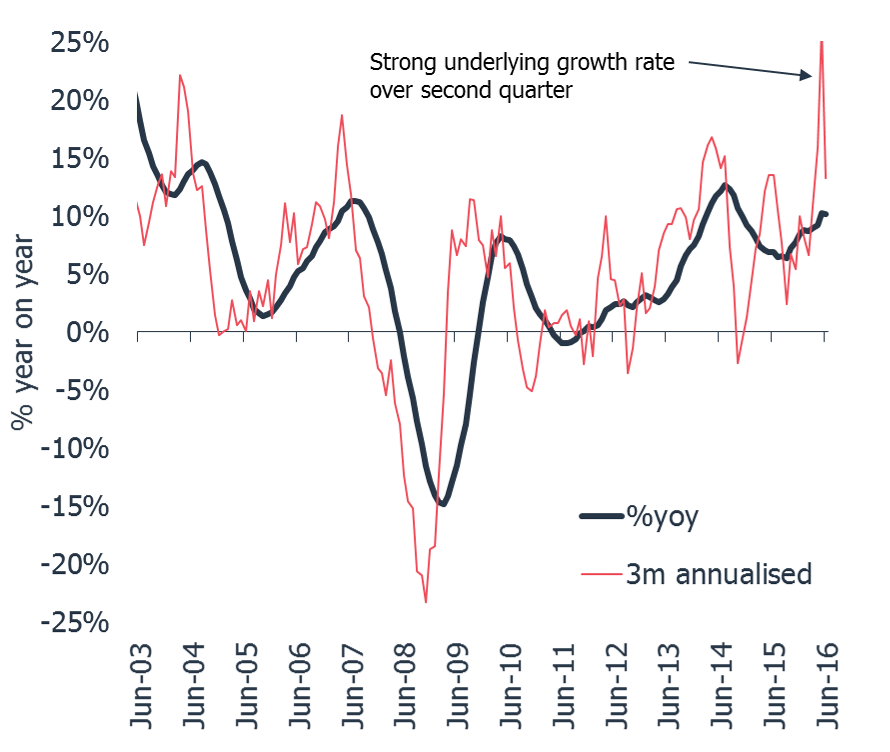
Double digit year on year growth has been sustained by the surge of investor demand ahead of the stamp duty change in April. Low mortgage rates and improving economic conditions have continued to attract households into the market against a backdrop of dwindling supply with the net result being continued upward pressure on prices. Figure 1 shows the annual rate of growth and the 3 month growth rate expressed on an annualised basis highlighting the recent support for headline growth.
At the half year stage Bristol remains the fastest growing city (14.7%), but a strong uplift in the growth rate has been registered in large cities such as Glasgow, Manchester, Liverpool and Leeds where house prices are comparatively affordable and yields above average and attractive to investors.
Waiting for signs of post-referendum impact
With the UK voting to leave the EU on 23 June attention turns to the impact of the vote on the economy and housing market. Time lags means official data is slow to emerge and housing is notoriously slow for changes of direction to emerge. Measures of housing market activity will lead changes in house price growth by 2-3 months. That said, we have reported signs of slowing growth in some cities, particularly in southern England where affordability levels are close to record highs. The slowdown might have been more apparent by now had the stamp duty change not been introduced.
Initial analysis of listings data
In order to track the latest trends in market activity Hometrack have conducted a specific analysis of property listings data at city level. This provides a snapshot of trends up until the middle of July 2016. Our analysis focuses on two sets of metrics.
The first metric is a comparison between the changes in the volume of new supply coming to the market, contrasting this to changes in the volume of listings flagged as sold or under-offer. The second is a longer run analysis of the ratio of new listings and sales. These metrics provide an early insight into trends in turnover and whether supply is starting to expand which could reduce price growth.
Figure 3 plots the difference between the average volume of new listings and sales over the 3 months to mid-July 2016 against the monthly average over the last 12 months. It shows that for these selected cities new supply has grown faster in the last 3 months than the average increase in supply seen over the last 12 months. For all cities in England and Wales excluding London new supply has grown 10% faster than the 12 month average, this rises to over 15% in London.
In contrast, the relative change in sales over the last 3 months has registered a relative fall of 8% in London i.e. 8% fewer homes sold in the last 3 months compared to the 12 month average. The relative change in Bristol is 0%, while in larger regional cities, where house price growth has been picking up momentum, the relative change is sales is positive at up to 7% in Manchester.
This analysis shows how recent sales momentum in regional cities, and higher house price growth, appears to have held up over the referendum period. In contrast, the headwinds facing the London market ahead of the vote have resulted in more supply and relatively fewer sales pointing to slower house price growth in the months ahead. This is something which is clearly evident at a more granular level across London’s localised markets where the highest value markets in central London are registering low single digit growth while in lower value, outer areas of London growth is still 15%-20% per annum although showing clear signs of losing momentum.
Fig. 3 – Relative change in new listings and sales - 3 months to mid-July against 12 month average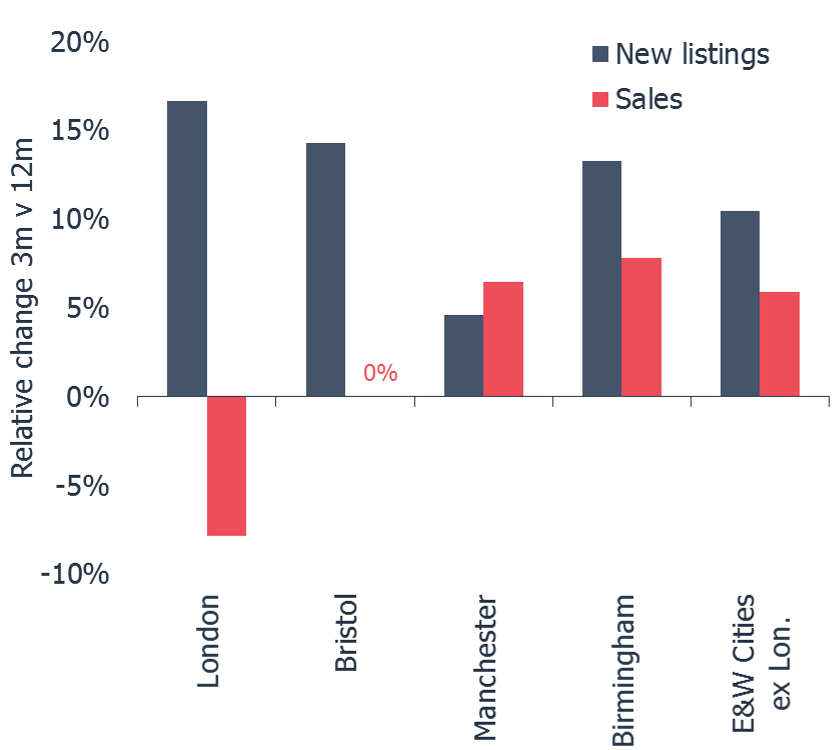
Long run trend in sales and new supply
The current dynamics between new supply and sales can be viewed in a longer term context by looking at the ratio between sales and new supply on a monthly basis over the last 3 years.
Figure 4 plots the sales/new supply ratio for London, Bristol and Manchester from 2013. A higher ratio means new listings (supply) is running ahead of sales, pointing to weaker house price growth. A lower ratio means greater scarcity of housing as new supply fails to match sales supporting faster house price growth.
Fig 4 - Ratio of sales to new listings by city


Source: Hometrack analysis of weekly listings data
The chart shows why Bristol and London have registered some of the highest rates of house price growth in recent years with the ratio fluctuating around one. The ratio for Bristol has remained below one since late 2014 and this has seen Bristol become the fastest growing UK city. In contrast, Manchester has seen a steady decline in the ratio since 2013 and this is consistent with increased rate of house price inflation in the last 18 months and current annual growth of 9% today compared to 1.5% in mid-2013.
The clearest recent trend has been the increase in the London ratio over the last 3 months as sales slow and supply continues to expand at a growing rate. This new supply is a combination of new homes filtering through from London’s expanded development pipeline, investors looking to take capital gains or selling to de-leverage as a result of the reduction in tax relief on mortgage payments. A similar trend is emerging in Bristol but to a lesser extent than in London.
Near term prospects
While this listings analysis provides a snapshot of the last quarter, the reality is that it is still very early days to assess the true impact of the EU referendum vote on activity and house prices.
Our view remains that sales volumes are likely to slow and price growth will moderate over the second half of the year. The severity of a slowdown will depend upon the response of consumers and businesses to the uncertainty created by the decision to leave the EU and the impact this has on the economy. The early market activity data confirms our view that London will bear the brunt of any slowdown.
June 2016 - Sales volumes likely to slow with price growth moderating post Brexit
Related articles
City level house price growth is holding steady at 8.4%. This month we reveal an updated view on city level affordability. This finds that after an 86% uplift in house prices since 2009, the price to earnings ratio in London now sits above 14x with Oxford and Cambridge close behind. Other cities are at or below their long run average. Read the Report to find out what this means for city level house price inflation.
City level house price growth is running at 8.5% but growth in London has slowed rapidly in the last quarter to the lowest level of quarterly growth for 20 months. Eleven cities are registering higher growth than at the start of 2016 while 9 are slowing.
The pace of city level house price inflation is slowing with growth in the year to August 2016 running at 8.2%. The 20 city index recorded its lowest level of quarterly growth (1.9%) for 6 months as a seasonal lull in market activity and weaker demand post Brexit and the March Stamp Duty change reduce the upward momentum of house price growth
The annual rate of house price inflation across the 20 cities has started to slow after 12 successive months of rising house price inflation A marked slowdown in the rate of growth over the last three months in London is behind the shift in momentum. However, house price growth in large regional cities outside southern England, continues to hold steady at 7-8% per annum with no sign of an imminent slowdown. Aberdeen is also registering a slower rate of price falls compared to recent months.

Subscribe to receive email updates.
HometrackGlobal:
Linked In: