Confirming payment details

Payment processing
Login or Sign up
Forgot password
Enter your email address and we will send you a password reset link or need more help?
October 2016 - London breaks 14x house price to earnings ratio
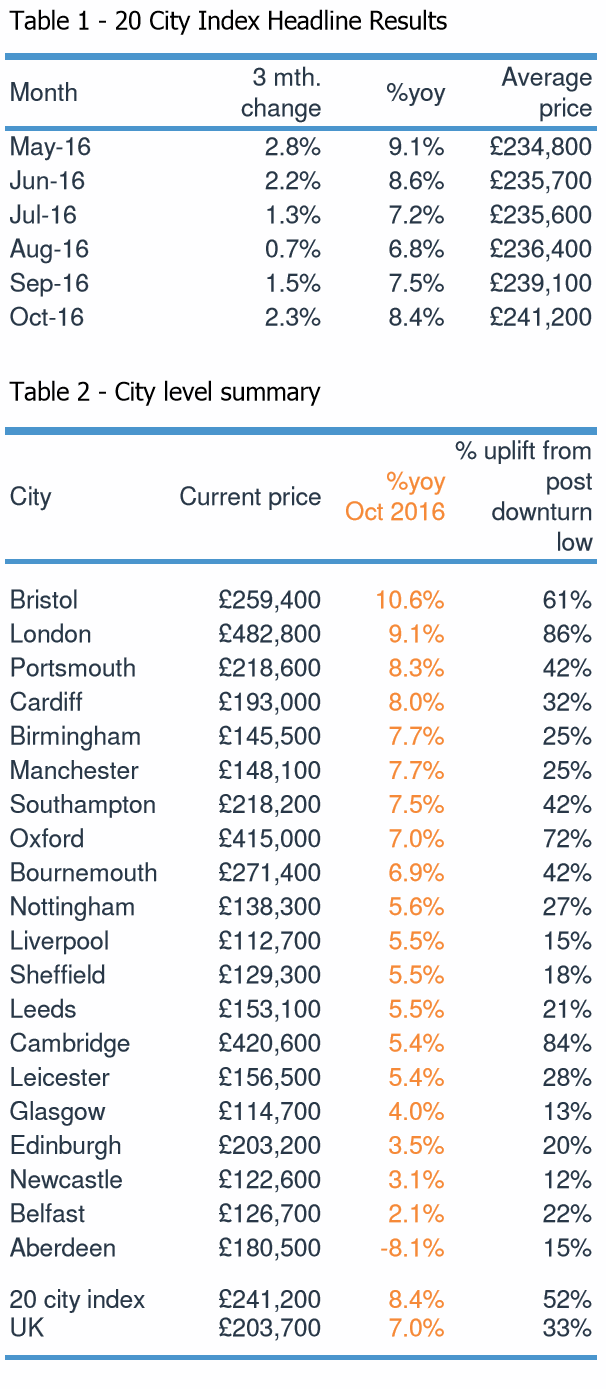
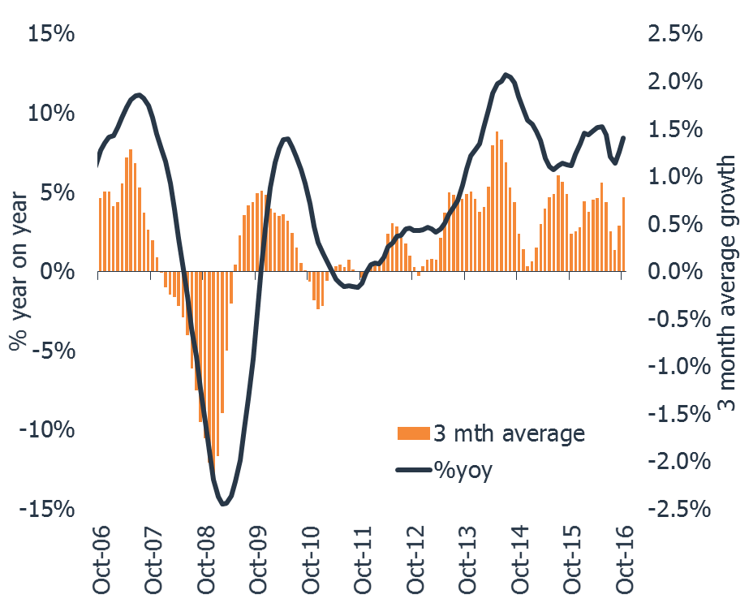
On 27 May, 2020- City level house price growth holding steady at 8.4%
- An 86% uplift in house prices since 2009 has pushed the price to earnings ratio in London over 14x, more than double the UK average of 6.5x
- Most cities have price to earnings ratio in line with long run average and room for price growth
City level house price growth is holding steady at 8.4%. This month we reveal an updated view on city level affordability. This finds that after an 86% uplift in house prices since 2009, the price to earnings ratio in London now sits above 14x with Oxford and Cambridge close behind. Other cities are at or below their long run average. Read the Report to find out what this means for city level house price inflation.
City house price growth outstrips UK
City level house price inflation is running at 8.4% as the upward momentum in house price continues. Bristol remains the fasting growing city (10.6%) but the rate of growth is slowing. Aberdeen continues to register a year on year price falls (-8.1%).
The impetus for house price growth is shifting from the affordability constrained cities in southern England to cities in the midlands and the north of England where affordability remains attractive.
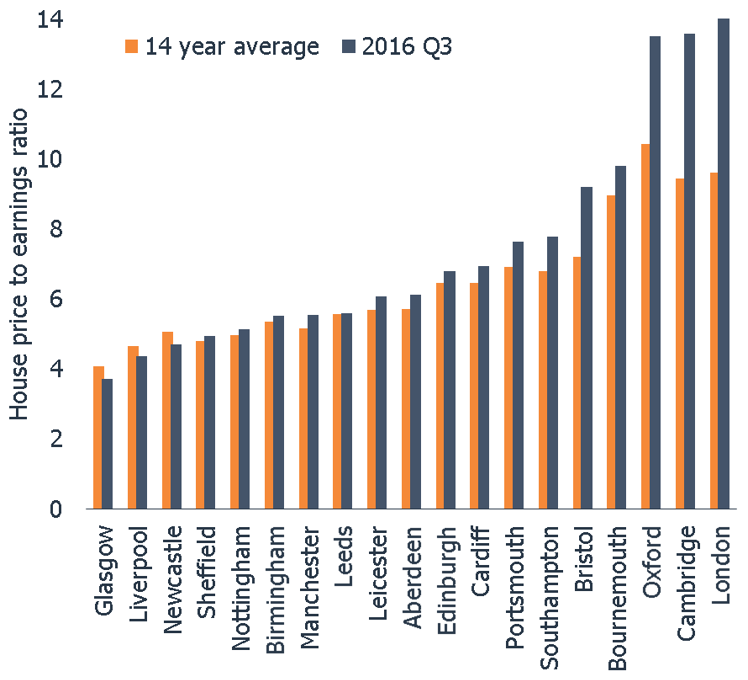
Price to earnings ratio in London at record high
An update of city level affordability reveals that the price to earnings ratio ranges from 3.7x in Glasgow to 14.1x in London, compared to a UK average of 6.5x. London has the highest price to earnings ratio on record as a lack of supply and strong demand fuelled by low mortgage rates has resulted in an 86% increase in house prices since 2009, far in excess of earnings growth. Cambridge and Oxford also have double digit price to earnings ratios which are well ahead of the average over the last 12 years.
City affordability in line with long run average
Affordability across other cities is more in line with the long run average, although strong house price growth in Bristol in the last 2 years has pushed the price to earnings ratio to 9.2x. Three cities have price to earnings ratios that are below the long run average, namely Glasgow, Liverpool and Newcastle where house price growth is starting to increase off a low base.
As affordability levels become stretched, fewer households can participate in the market which will lead to reduced levels of turnover and a resulting slowdown in the rate of house price growth.
London growth close to 3 year low
The year on year rate of house price growth across London has slowed close to its lowest level for 3 years (9%). We expect growth to slow to low single digits in the next 6-12 months as demand softens in the wake of a raft of fiscal policy changes aimed at overseas buyers and investors as well as concerns over the impact of Brexit on the economy. The Hometrack Central London index which covers the top 5% of the London market by value and is already registering 0% house price growth.
Where next?
In the short term we expect regional cities to continue to drive house price growth. Many of these cities have seen relatively limited house price growth in the last 6 years and have significant upside for house price inflation (table 2). This is subject to the outlook for the economy, borrowing costs, earnings growth over 2017 as the Brexit process is started. We will focus on the outlook for 2017 in more detail in the next edition of the index.
October 2016 - London breaks 14x house price to earnings ratio
Related articles
City level house price growth is running at 8.5% but growth in London has slowed rapidly in the last quarter to the lowest level of quarterly growth for 20 months. Eleven cities are registering higher growth than at the start of 2016 while 9 are slowing.
The pace of city level house price inflation is slowing with growth in the year to August 2016 running at 8.2%. The 20 city index recorded its lowest level of quarterly growth (1.9%) for 6 months as a seasonal lull in market activity and weaker demand post Brexit and the March Stamp Duty change reduce the upward momentum of house price growth
The annual rate of house price inflation across the 20 cities has started to slow after 12 successive months of rising house price inflation A marked slowdown in the rate of growth over the last three months in London is behind the shift in momentum. However, house price growth in large regional cities outside southern England, continues to hold steady at 7-8% per annum with no sign of an imminent slowdown. Aberdeen is also registering a slower rate of price falls compared to recent months.
It is still very early days to assess the true impact of the EU referendum vote on activity and house prices. Hometrack's view, based on our Cities Index and analysis of listings data, remains that sales volumes are likely to slow and price growth will moderate over the second half of the year.

Subscribe to receive email updates.
HometrackGlobal:
Linked In: