Confirming payment details

Payment processing
Login or Sign up
Forgot password
Enter your email address and we will send you a password reset link or need more help?
September 2016 - London records lowest quarterly growth for 20 months
On 20 October, 2016- City level house price growth running at 8.5%, up from 5.7% a year ago.
- Eleven cities have annual growth rates higher than in January 2016, nine are lower.
- London records lowest quarterly growth for 20 months as demand weakens and supply grows.
City level house price growth is running at 8.5% but growth in London has slowed rapidly in the last quarter to the lowest level of quarterly growth for 20 months. Eleven cities are registering higher growth than at the start of 2016 while 9 are slowing.
City house price growth outstrips UK
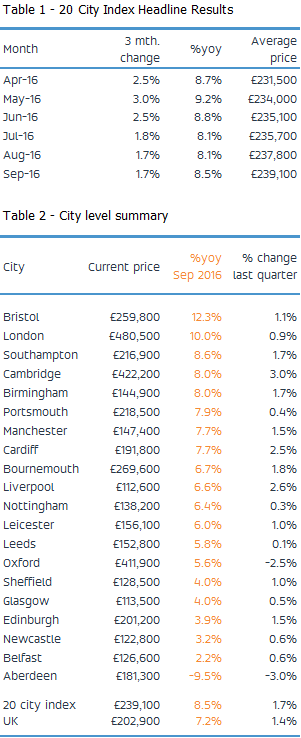
House price inflation across the UK Cities House Price Index is holding steady at 8.5% per annum, higher than the 5.7% growth recorded twelve months ago. Residential values across UK Cities are registering a higher rate of growth than the overall UK market where house price growth is running at 7.2% per annum. House price inflation continues to run more than three times faster than the growth in earnings as household confidence improves, earnings rise ahead of inflation and low mortgage rates make housing affordable for those with equity.
Growth rates rising across 11 cities
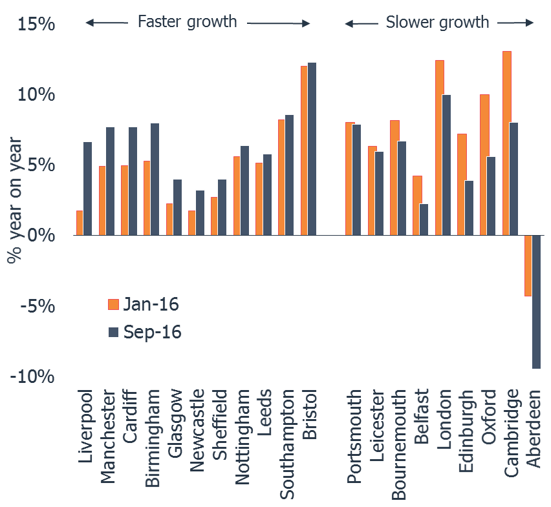
Eleven cities are registering higher rates of capital growth than in January 2016. The majority of these are large regional cities outside the south east of England – Liverpool, Manchester, Cardiff and Birmingham. These cities have attractive affordability on a price/earnings ratio measure with house prices rising off a low base. Annual house price growth currently ranges from 6.6% in Liverpool to 8.0% in Birmingham (Fig.1).
Growth slower across nine cities
Nine cities are registering house price growth lower than at the start of 2016 with the greatest slowdown led by Cambridge, Oxford, London and Aberdeen. Slower growth is a result of affordability, economic and market confidence factors.
London records slowest growth for 20 months
In the last quarter, London residential values have recorded their lowest growth rate since January 2015. Fears of a potential housing bubble, tightening credit terms and concerns over a mansion tax impacted demand for housing in London at this time.
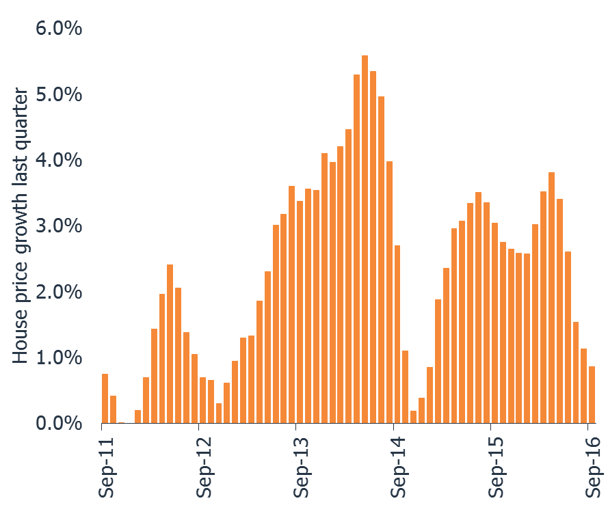
In the last quarter, London residential values have increased by 0.9%, compared to an average of 3.0% over the last 3 years. The recent slowdown is yet to impact the annual rate of growth which is running at 10% but is expected to move towards 5% by the year end.
Supply/demand balance varies across cities
These patterns of relative house price growth are re-enforced by an analysis of property listings and sales data over the last 3 years. Sales rates are close to matching the flow of new property to the market, creating scarcity and supporting house price growth.
In contrast, London has the weakest market conditions with the new supply of homes coming to the market growing faster than sales which have fallen back in recent months on weaker demand. The ratio of sales to new supply is at its highest level for 3 years, re-enforcing the outlook for a continued slowdown in the rate of house price growth across London in the months ahead.
September 2016 - London records lowest quarterly growth for 20 months
Related articles
City level house price growth is holding steady at 8.4%. This month we reveal an updated view on city level affordability. This finds that after an 86% uplift in house prices since 2009, the price to earnings ratio in London now sits above 14x with Oxford and Cambridge close behind. Other cities are at or below their long run average. Read the Report to find out what this means for city level house price inflation.
The pace of city level house price inflation is slowing with growth in the year to August 2016 running at 8.2%. The 20 city index recorded its lowest level of quarterly growth (1.9%) for 6 months as a seasonal lull in market activity and weaker demand post Brexit and the March Stamp Duty change reduce the upward momentum of house price growth
The annual rate of house price inflation across the 20 cities has started to slow after 12 successive months of rising house price inflation A marked slowdown in the rate of growth over the last three months in London is behind the shift in momentum. However, house price growth in large regional cities outside southern England, continues to hold steady at 7-8% per annum with no sign of an imminent slowdown. Aberdeen is also registering a slower rate of price falls compared to recent months.
It is still very early days to assess the true impact of the EU referendum vote on activity and house prices. Hometrack's view, based on our Cities Index and analysis of listings data, remains that sales volumes are likely to slow and price growth will moderate over the second half of the year.

Subscribe to receive email updates.
HometrackGlobal:
Linked In: